Secular Drivers Trump Cyclical Slump
FRCB is the best positioned to weather Trump’s tariff uncertainties and potentially benefit it, if it can follow TSMC to Arizona.
Stock information
FRONTKEN
FRONTKEN - 0128.KL
BUY
Target price: RM4.80
Last price: RM4.12
Market cap: RM6,529m
Shares out: 1,585m
52-week range: RM2.63 / RM4.78
3M ADV: RM16m
T12M returns: -8%
Disclaimer: By using this information, you hereby acknowledge that you are fully and solely responsible for evaluating the merits and risks of any investment decision and agree not to hold NewParadigm Research fully liable whatsoever for any actions, omissions and/or damages of any kind or matter arising from such decision.
Key points
- Tech sector risk-reward is skewed to the downside, with real demand impacts yet to materialize – OSATs face steepest cyclical risk.
- Initiate FRCB with RM4.80 TP – high floor on earnings and optionality to capture TSMC’s overseas expansion.
- If earnings and ADV gap continues to narrow, FRCB could unseat
INRI as the flagship large cap tech stock over the medium term.
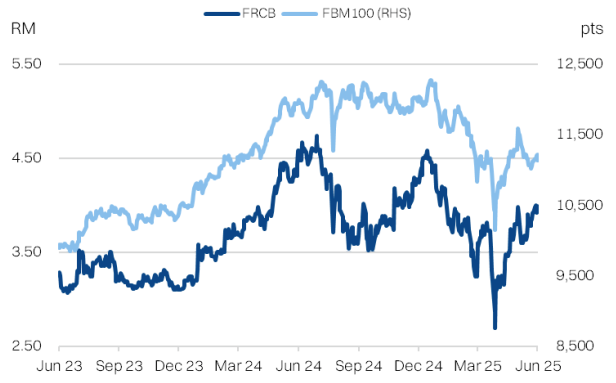
FRCB share price performance
Investment fundamentals
| RMm | FY24A | FY25E | FY26E | FY27E |
|---|---|---|---|---|
| Revenue | 569.2 | 644.9 | 780.5 | 913.1 |
| Revenue growth | 14% | 13% | 21% | 17% |
| EBITDA | 212.5 | 245.6 | 299.2 | 356 |
| EBITDA margin | 37% | 38% | 38% | 39% |
| PATAMI | 136.8 | 162.5 | 200.6 | 241 |
| PATAMI margin | 24% | 25% | 26% | 26% |
| ROA | 14% | 15% | 16% | 16% |
| ROE | 18% | 19% | 20% | 21% |
| PER | 47.7 | 40.2 | 32.5 | 27.1 |
| P/BV | 8.4 | 7.4 | 6.5 | 5.6 |
| Yield | 1% | 1% | 1% | 2% |
Source: Bloomberg, NewParadigm Research, 2025
Tech: Moving on from the TACO trade
- We are underweight the broader tech sector as stocks have mostly recovered to pre-liberation day levels. We position broader tech as a trading sector and advise holding out for steep corrections to accumulate at better valuations.
- The market is no longer jumping on tariff news flow alone, as the TACO trade (Trump-always-chickens-out) is exhausted. After all, how many times can the proverbial boy cry wolf? Still, there is a substantial non-zero risk of wolves materializing – the transmission of the tariff tantrums to the real economy. Weak end-demand will be especially prominent for consumer electronics and automotive supply chains. The weak US dollar (bad for exporters) and inflationary pressures on costs don’t help either.
- Our least preferred sub-segment are the OSAT’s. High operating leverage and forex sensitivity make them especially vulnerable to the aforementioned shocks. Despite a 40-60% drop in consensus expectations for sector earnings, we think forward expectations are still on the high side. In short, better to buy on bad results/news.
Frontken as the top sector pick
- Our initiation TP of RM4.80 is pegged to 37x FY26E PER; +2SD to the 3yr trailing average PER and against +21% earnings CAGR.
- We anticipate unrealised forex losses from a recently aborted overseas acquisition could depress headline earnings in 2Q25E. This would be a buying opportunity as we expect underlying earnings to continue accelerating at a mid-teens QoQ pace, in-line with TSMC (reporting on 17 July).
- FRCB is the best positioned to weather Trump’s tariff uncertainties and potentially benefit it, if it can follow TSMC to Arizona. Our bull case fair value of RM6.30 on a 37x FY27 PER.
- FRCB’s reliable compounding growth is also bringing it within striking distance to overtake INRI as the de-facto sector flagship stock, in the coming 1-2 years. FRCB is able to progress technologically with its key customer into the leading-edge but OSAT’s appear to have hit a ceiling with packaging technology.
- FRCB has been able to follow TSMC on towards 3nm and now qualifying for 2NM. Already preparing a third plant in Taiwan to continue expanding capacity.
About the company
Providing precision cleaning services to leading-edge foundries in Taiwan, where it derives almost 70% of revenues and over 80% of operating profits. It is a relatively high margin business. FRCB’s key customers includes TSMC, and both stocks have historically enjoyed a reliable correlation in earnings. FRCB also runs a non-core O&G business which includes maintenance, repair and overhaul of industrial equipment. FRCB boasts a strong track-record in retaining market share with its customer as well as securing qualification for new nodes.
About the stock
Frontken is among the top 3 largest companies by market cap within the
semiconductor sector in Malaysia. It is seen as the best proxy to front-end
semiconductors (fabs), as most of its peers are back-end packaging OSAT’s
and/or equipment makers (capital goods) for the sector. The stock is well institutionalized with EPF holding almost 10% of the stock. On the other side of the coin, the stock is tightly held by institutions and is relatively illiquid. In turn, Frontken trades on premium valuations of >30x PER - even higher than TSMC's high teens PER.
Investment thesis
Frontken is the best domestic exposure to semiconductor front-end in Malaysia. It boasts more stable and persistent secular drivers, due to its leverage to leading edge processes and customer stickiness. It is also more defensive through the cycle compared with OSAT peers and not exposed to dollar weakness. Frontken's premium valuations is also further justified by the option to match TSMC's capacity expansion into new regions as well as potential to montize intellectual property.
Key risks
- High customer concentration risk. While the probability is very low, any
operational mistakes/lapses that result in the loss of confidence by the
customer poses steep financial risk to FRCB. - High expectations for earnings delivery - having been consistently profitable since 2016. We anticipate there could be strong negative share price reaction if there is a significant miss to earnings and/or steep downgrade in guidance.
- Geopolitical risk: Frontken is highly exposed to the broader Taiwanese front-end semiconductor ecosystem. Any structural shocks to the industry would pose significant downside risk to both profitability and valuations.
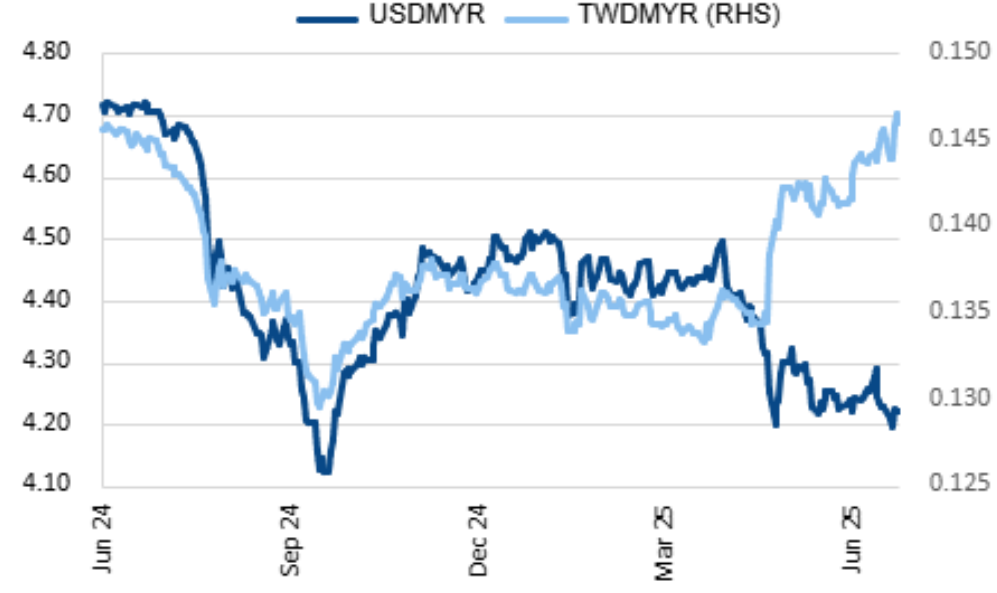
Currency divergence favors FRCB
Secular tailwinds distinguish Frontken
We initiate coverage on Frontken with a BUY rating and target price of RM4.80 on 37.6x FY26E PER. We think FRCB could emerge as the face of the Malaysian tech sector in the next 1-2 years, and with it, better trading liquidity and support for more premium valuations.
FRCB is proving to be the most reliable earnings compounder in the sector, and with OSAT peers facing more downside risk through the cycle and waning secular drivers. In plain speak, FRCB has been able to closely follow its key customer, TSMC, as the latter trailblazes the leading-edge semiconductors. In stark contrast, OSAT’s are running into a technological ceiling as the latest packaging technologies are tightly held onshore in Taiwan.
In turn, we make the case that FRCB on its current trajectory could overtake INRI as the de-facto flagship stock in the tech sector. This should spark a positive feedback loop that boosts trading liquidity, pulls in more passive funds, and prop-up valuations.
In the short-term, OSAT’s also face higher risk of earnings downgrades due to weaker end-demand in consumer electronics and automotive segments. Additionally, as exporters, OSAT’s are directly exposed to the weaker US Dollar that has usually helped offset weak demand cycles.
In contrast, the TWD’s strengthening against the ringgit by ~10% will be a tailwind for FRCB. It is worth noting that these are purely translation gains as FRCB’s key
operations are in TWD, but it reports in ringgit.
That said, we do flag that FRCB may report some non-core unrecognised forex losses in the coming 2Q25 results, following the aborted attempt to acquire a subsidiary in the US. We’d strip such a one-off from our numbers, but any knee-jerk selling on the depressed headline earning numbers could present an opportunity to collect FRCB shares a little cheaper.
Looking ahead, FRCB’s catalysts includes potential expansion to the US and Singapore – key markets where its major customer TSMC is also expanding. These moves have been long discussed, but yet to crystalize. Additionally, FRCB is also preparing for a third plant in Taiwan that will be key to supporting TSMC’s relentless capacity expansion.
Summary:
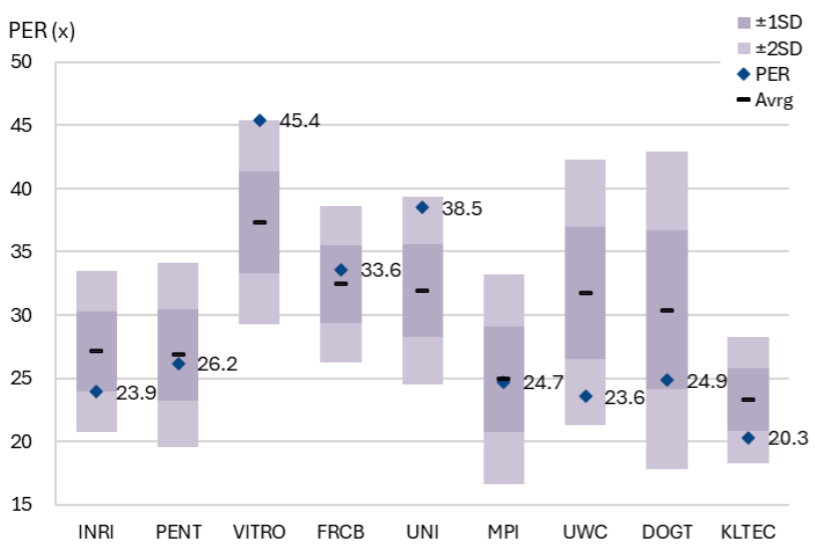
We value FRCB at 37.6x FY26E PER, which is at +2StdDev vs the trailing 3-yr average PER. Pairing the aforementioned qualitative arguments with a solid +21% earnings CAGR (FY27E), which should lead the sector, we think the valuations are justified. Keep in mind that this is still well-below the LT range that boasts a +2StdDev valuation of 48x PER.
Meanwhile, we think the rest of the tech sector is more suitable for trading at this point in the cycle. With risk-reward tilted to the downside, we recommend revisiting said stocks if/when there are market corrections on earnings disappointments/downgrades.
The top spot in the tech sector could be up for grabs
We anticipate that the complexion of the Malaysian tech sector should evolve as it
transitions through the current cycle. Historically, OSAT’s have enjoyed the lion’s share of market attention, due to the large earnings base that have made these stocks the de-facto market flagship counters. Inari (INRI) has held this position virtually unchallenged for the past decade, since taking over the top spot from Unisem (UNI) and Malaysian Pacific Industries (MPI).
Frontken taking the top step in the sector, would be a paradigm shift.
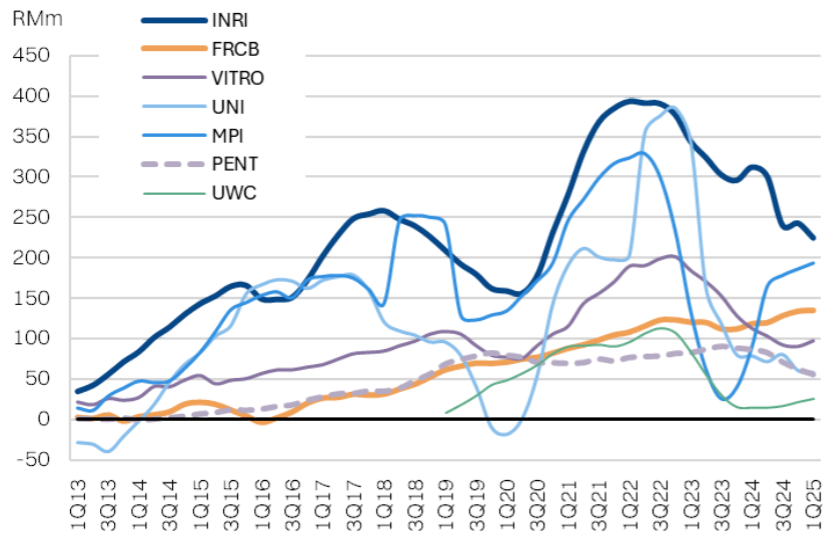
Chart 1: Tech sector market cap - Inari has dominated in the past decade
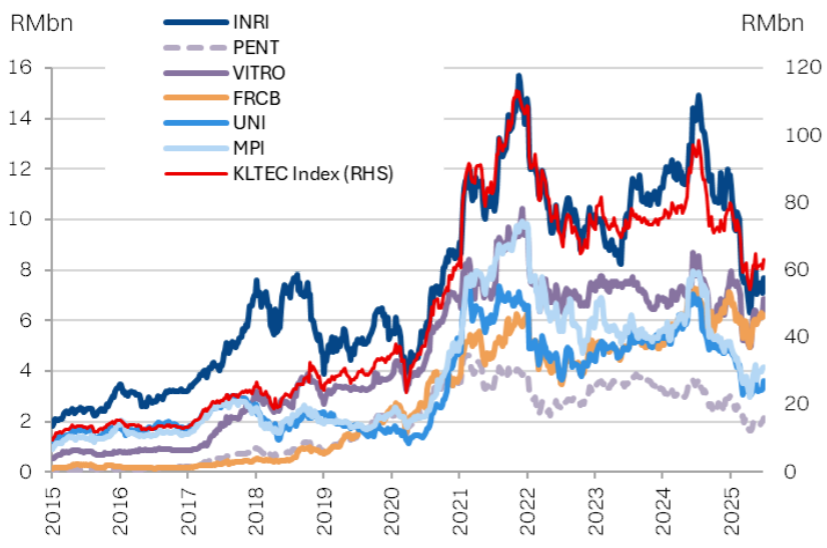
Chart 2: Tech sector market cap - same chart, more recent time frame
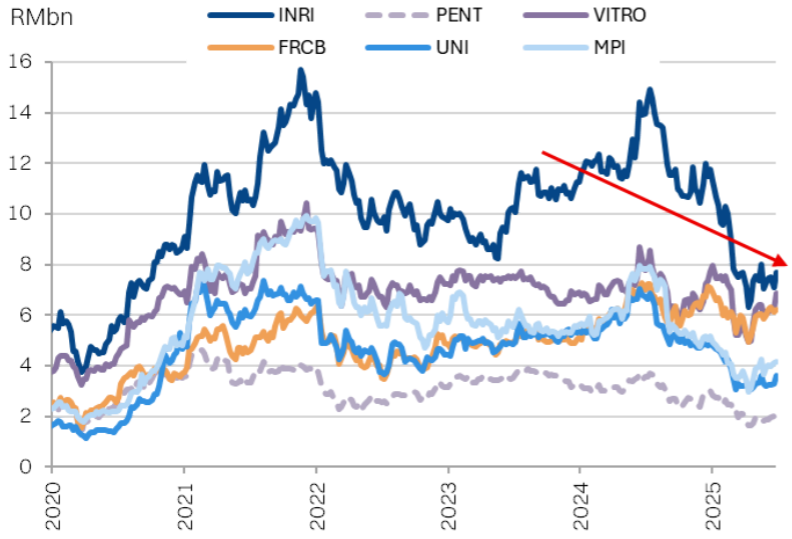
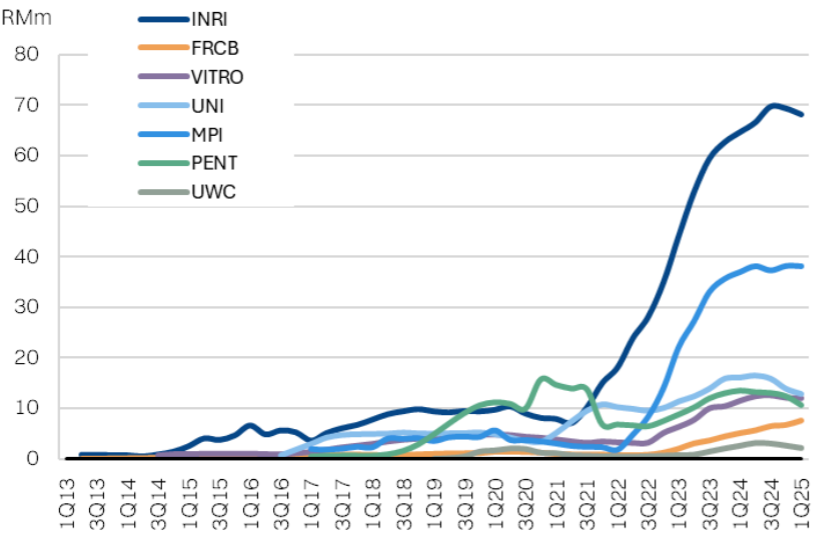
Market cap alone does not tell the whole story. INRI also boasts the highest trading liquidity in the sector, with ADV oftentimes 3-4x above its next closest peer. This is why ViTrox, which we regard as the highest quality name in the sector – due to its strong R&D-driven growth – is not able to contend for the top spot. ViTrox shares are tightly held by management (52%), limiting free float and capping trading velocity. In this regard, FRCB has narrowed the gap to INRI to consistently retrain the position as the
Chart 3: Average daily value traded - INRI is the most liquid tech stock
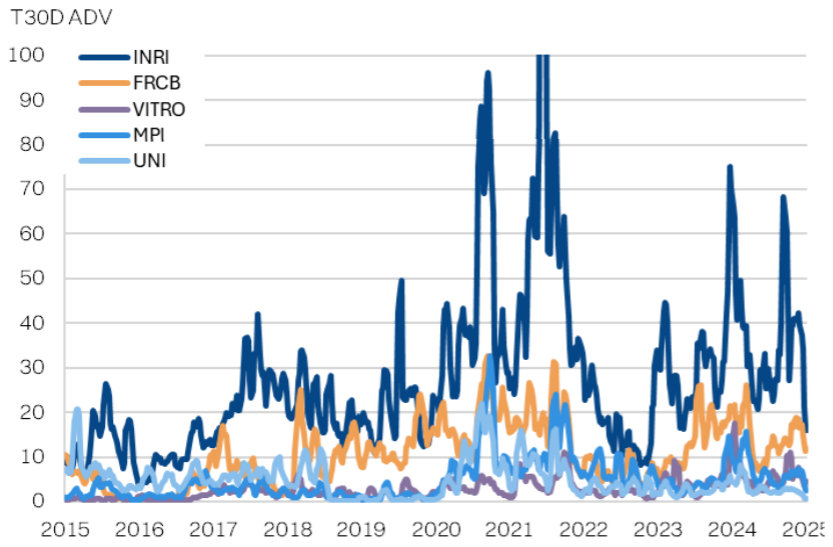
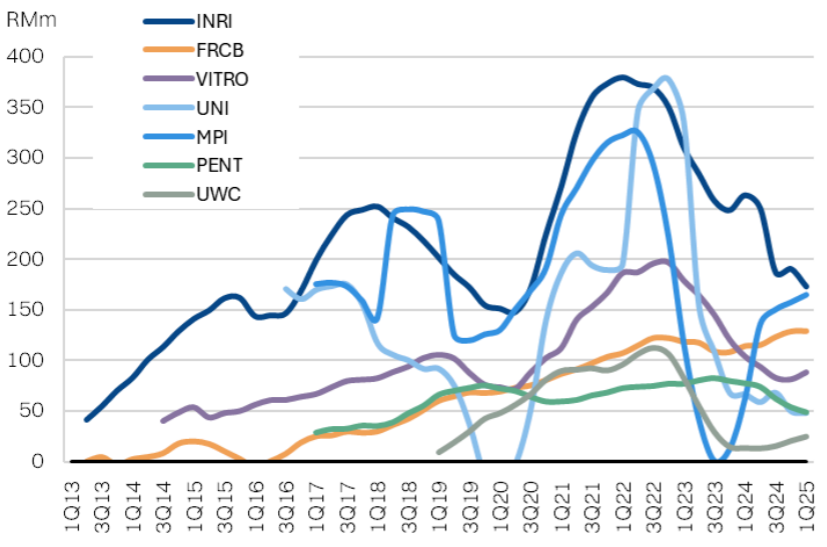
Ultimately however, it will boil down to earnings. INRI at its peak in 2022 posted almost RM400m PATAMI (T12M), which dwarfed its peers – almost 4x FRCB’s earnings base at the same time. Some of the other OSAT’s (UNI, MPI) did come close in terms of earnings but typically had lower-quality and more volatile earnings and thus were not able to match INRI’s valuation premiums.
However, FRCB’s earnings growth has closed the gap. The consistent and less cyclical growth trajectory now puts FRCB’s earnings at only 60% of INRI’s as of 1Q25 (T12M). We anticipate the gap will continue to narrow further in the ST as the OSAT’s face steeper cyclical headwinds. Critically, we think the medium-term secular drivers also favour FRCB.
The OSAT’s biggest challenge going forward, has been the inability to continue
onboarding the latest advanced packaging technologies. These leading-edge packaging technologies have largely remained onshore in Taiwan, as these new
processes are seen as a proprietary differentiator for leading edge chips as well as
being increasingly integrated with front-end processes. In short, OSAT’s, for now at least, are limited from modernising.
At a high level, this resigns the OSAT’s to more mature technologies where barriers to entry are lower, competition is steep and margins increasingly thin.
Chart 4: Tech sector T12M PATAMI - Convergence
Specific to INRI, this headwind is further compounded by the stagnation in volume growth of its key end-market – iPhones – that has underpinned growth in its key RF segment for the past decade. iPhone volume growth is projected to boast only very marginal growth (~2% p.a) over the long-term, due to market saturation and lengthening replacement cycles. If anything, the risk to sales volumes are persistently on the downside.
Additionally, aside from the initial step up in RF filter density headed into the 5G era, RF content growth has also stagnated. INRI sole customer for the segment, Broadcom, has been guiding for flat growth in the near-term for the corresponding wireless segment and we expect INRI’s RF segment to match it.
To be fair, INRI’s management has been proactively seeking new customers and
products to diversify its revenues away from RF, which consistently make up over 60% of revenues. However, it has not been able to rope in a significant new customer programme. We estimate that new customer projects will barely contribute 10% to revenues in FY25 (ended-June). Furthermore, the scale of new customer projects is quite limited in scale at ~RM100-150m per project, across various segments – power semiconductors, memory, and optoelectronics. This only adds 8-10% new revenue per project, assuming full scale-up. On top of this, margins for aforementioned new programs are all lower than the RF segment.
In short – it is really tough to find another customer as good as Broadcom or a product as significant as RF filters for iPhones.
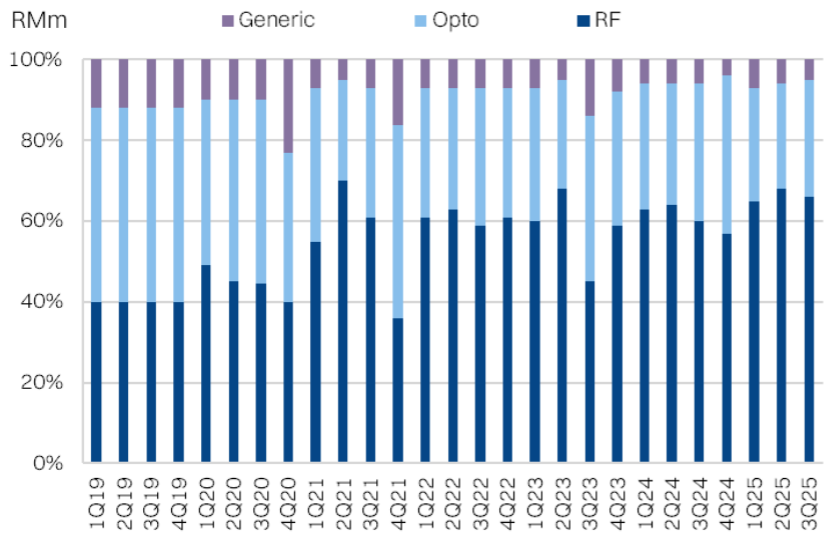
Chart 5: Inari's revenue breakdown by segment
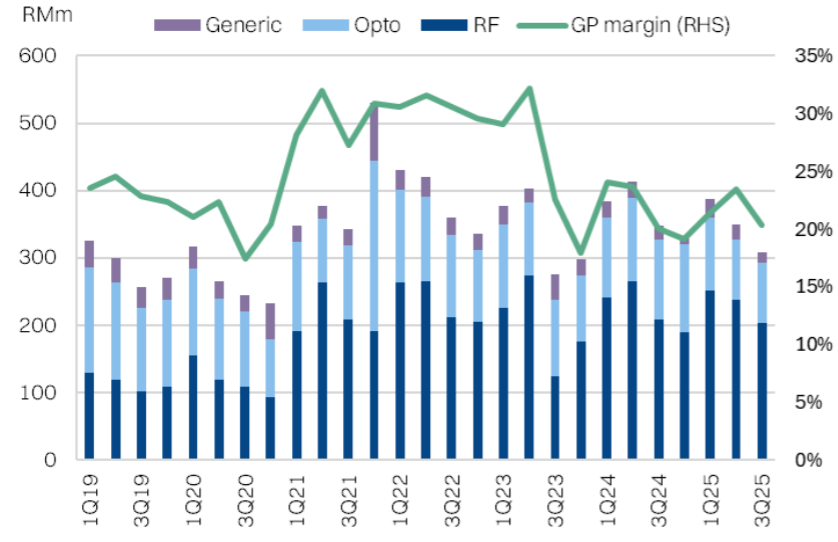
Chart 6: Inari's revenue breakdown by segment
OSAT's falling earnings quality
The OSAT’s limitation on technological advancement is reflected by the lack of
investment and bloating cash piles on balance sheets. INRI is most emblematic of this malaise with over RM2.2bn in cash on hand – almost 28% of its market cap - the highest in the sector.
In turn, an estimated ~20% of INRI’s earnings now come from interest income. This is a low-quality driver of earnings, in our view, and interest income should not have a high multiple applied to it. A more conservative approach would be to value cash and cash-derived earnings separately. After all, investors don’t buy tech stocks to tap into 2-3% yields on cash balances and visibility of investment into new technology.
Chart 7: Revenue projections
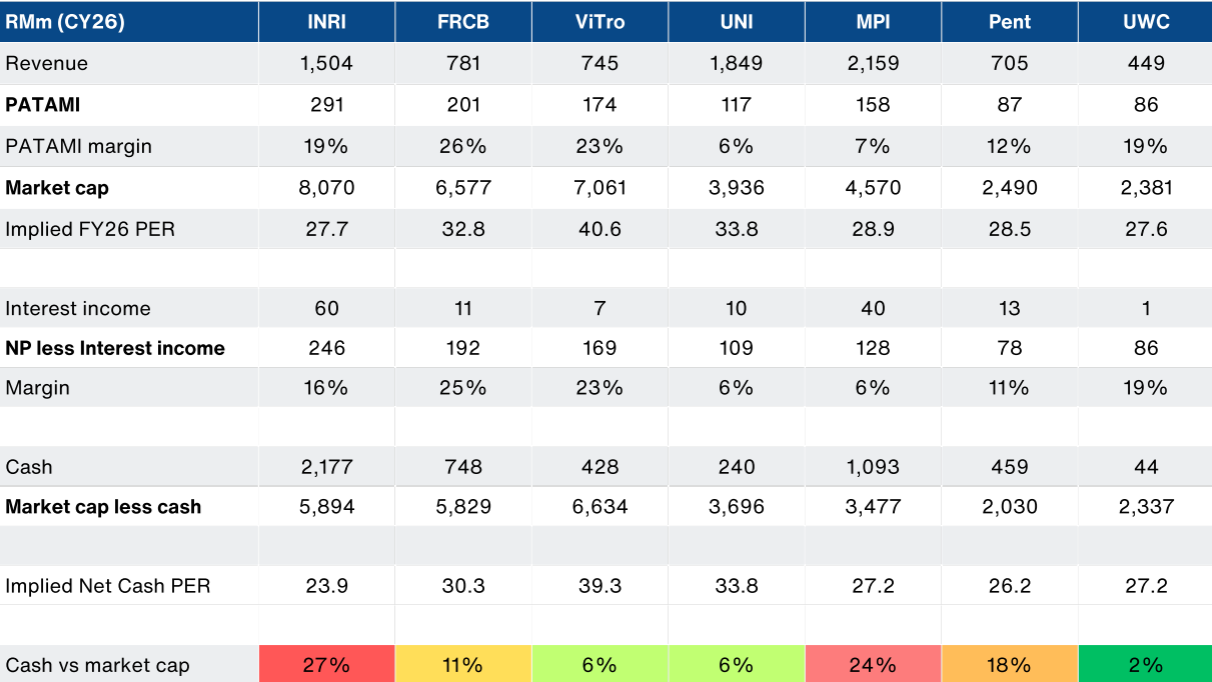
Chart 8: Interest income for tech sector
If we were to strip out the low-quality interest income, FRCB’s earnings convergence with INRI is even more stark – now only 25% below INRI. It is also worth noting that FRCB’s earnings is substantially less volatile than its OSAT peers.
Chart 9: PATAMI less interest income
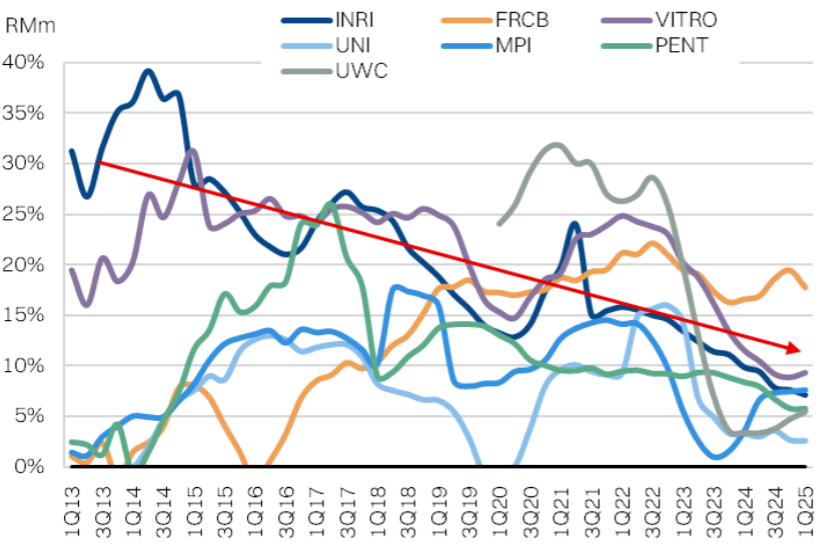
On the other hand, managements’ rationale to hoarding cash on the balance sheet is for potential acquisitions. While this is a viable growth strategy, we note that it is difficult to price in the potential optionality of such acquisitions. Furthermore, the industry has limited track record of substantial and quality acquisitions over the past decade. In the meantime, the opportunity cost of hoarding the surplus capital has translated to a significant drag on ROE’s, with most of the sector now below 10%.
While cyclicality has a role to play in the recent depression of sector ROE’s FRCB now boasts the highest ROEs in the sector (among the large cap names), at 19% ROE.
Chart 10: Return-on-Equity
We anticipate that FRCB’s earnings gap to INRI will continue to narrow as it continues to compound growth. Critically, with higher quality and reliable earnings drivers. In turn, we think there will be a potential tipping point where FRCB overtakes INRI as the largest market cap tech stock and begins to assume the role as the de-facto flagship stock for the sector.
Chart 11: Sector valuations
Earnings outlook: +20% CAGR
We are forecasting Frontken’s average PATAMI growth of ~21% over the next 3 years, placing our forecasts marginally behind consensus expectations.
Importantly, we flag that the headline reported earnings for the coming 2QFY25 could be coloured by potential one-offs, including forex adjustments arising from the now-abandoned attempt to acquire to expand into the US via an acquisition. We would see such a hit as a one-off and any pressure on the share price as a buying opportunity.
Looking ahead, our earnings outlook is underpinned by continued ~20% growth in the precision cleaning services segment, coupled with margins remaining at an elevated level. We have assumed MYRTWD remains at current levels of 6.9-7.0.
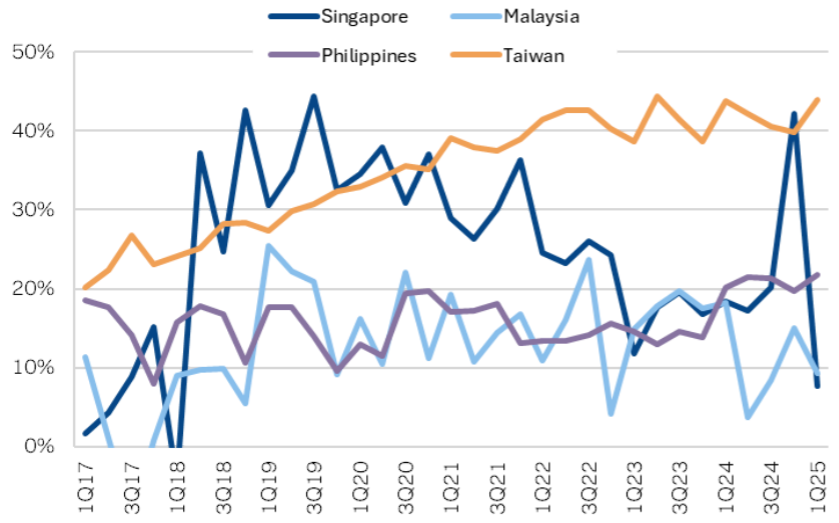
Frontken does not provide an earnings breakdown by operating segment, but rather by geography. Taiwan contributes about 68% of total revenues and the segment boast the highest operating profit margins of >40%. In turn, Taiwan makes up about 85% of operating profits. This geographic segment effective captures all the precision cleaning services provided to the major fabs in Taiwan, including Frontken’s largest customer, TSMC.
It is also impressive that the operating margins for this segment have maintained a
slight uptrend over the years. In our view, this underscores Frontken’s ability to expand value-add for customers in an industry where continuous cost-down pressure from customers would be the norm. This can be attributed to Frontken reliably securing cleaning orders for new tooling parts and matching its customers’ leading-edge developments.
Chart 12: Earnings vs consensus
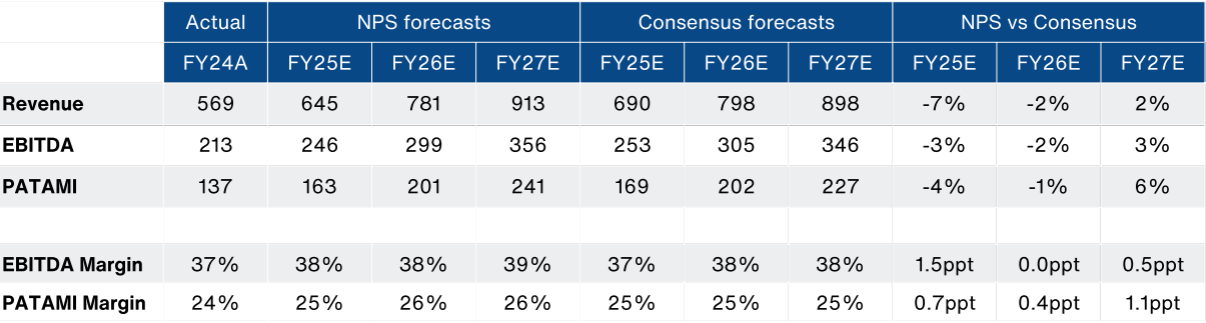
Chart 13: Frontken's revenue by geography
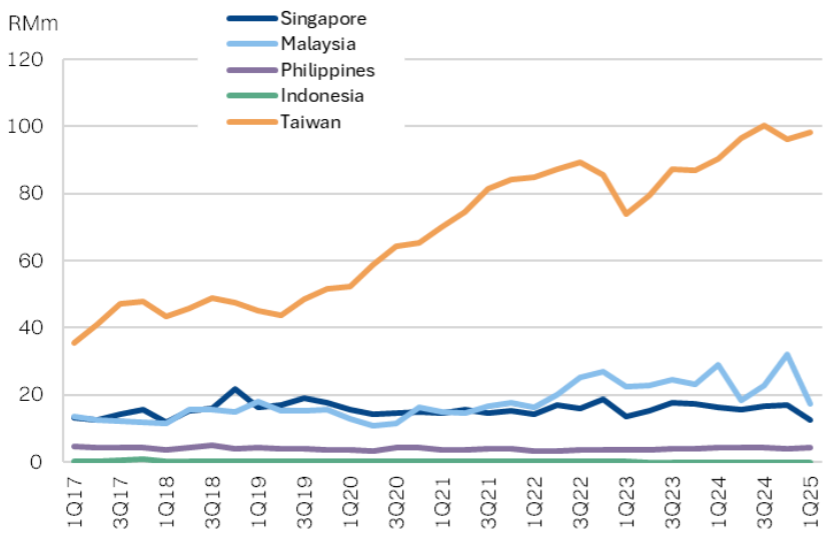
Chart 14: Frontken's operating profit by geography
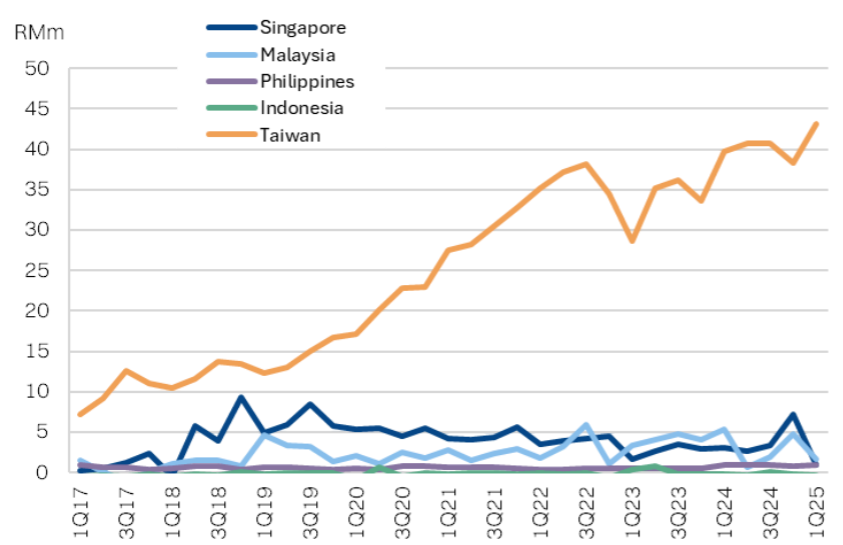
Chart 15: Frontken's operating margin by geography
Frontken’s earnings are challenging to model bottom-up as the company’s disclosures are limited by confidentiality commitments with key customers. In turn, modelling Frontken’s earnings in a bottom-up manner substantially limited. Instead, we take a top-down approach given the strong correlation between TSMC’s revenue trend and FRCB’s Taiwanese revenue of almost 90%.
Chart 16: FRCB Taiwan revenue vs TSMC's revenue
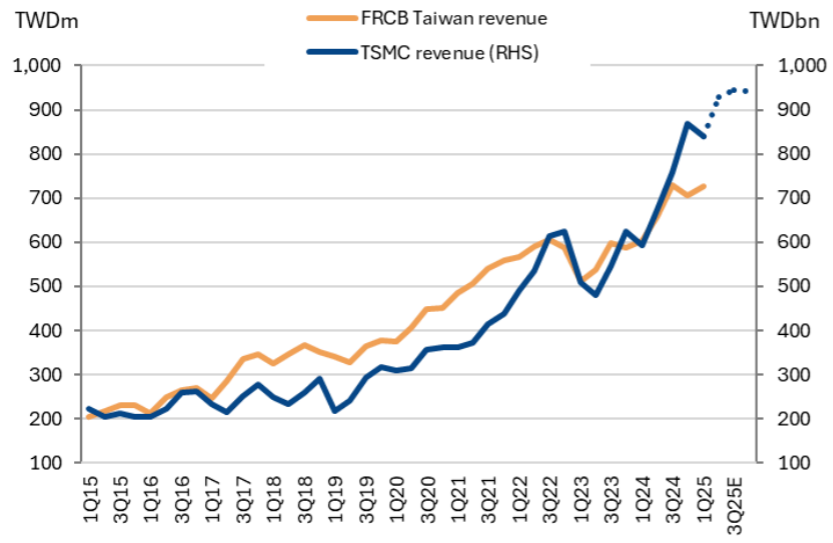
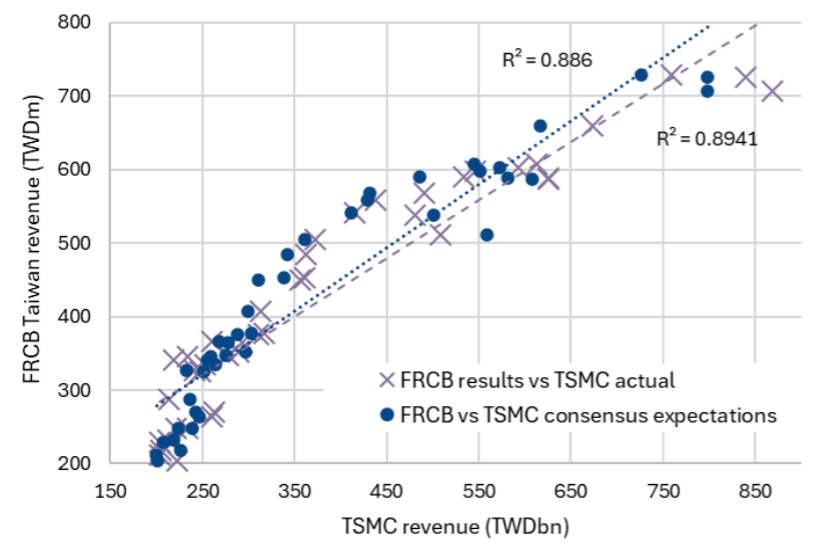
Chart 17: Strong correlation with both actual reported and consensus forecasts
2Q25E preview: mid-teens QoQ growth, underlying
The high correlation between TSMC’s revenue and FRCB’s Taiwan-based revenues
(85% of total mix) provides a high degree of confidence ST earnings outlook. TSMC will be reporting earnings on July 17 , where consensus is expecting a 11% QoQ growth in revenues. Adjusting for the rapid strengthening in the TWD, we anticipate this could translate into mid-teens QoQ revenue growth for FRCB.
Long-term earnings outlook
We look to TSMC’s capex outlook as a yardstick for FRCB’s LT earnings outlook. Historically, FRCB’s Taiwan domiciled earnings has a ~71% correlation with TSMC’s capex profile. This makes sense as TSMC’s revenue a direct function of its capex. It is also worth noting that short-term swings in TSMC’s capex, which can be lumpy, does not translate to ST volatility in FRCB’s earnings which are linked to production volumes.
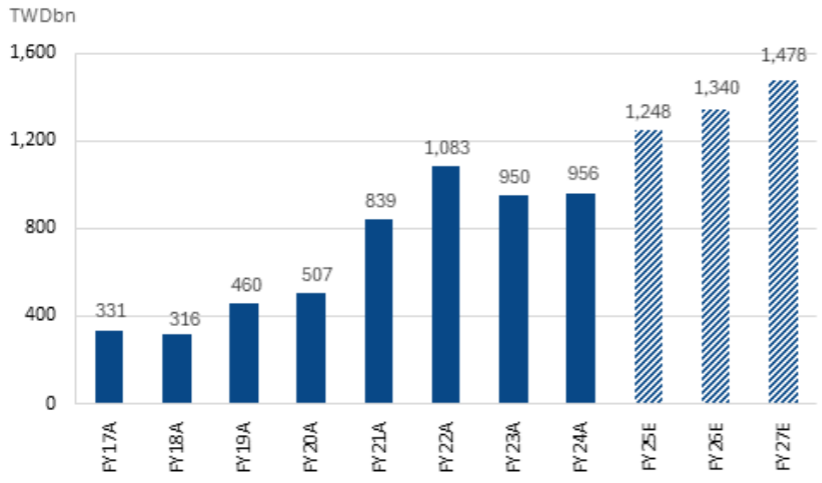
The street is forecasting ~15% 3yr CAPEX CAGR for TSMC, to TWD1.48tn, while we are forecasting ~20% 3yr CAGR in ringgit terms or 17% in TWD terms, which we think is very reasonable.
To match TSMC’s growing capacity, FRCB has already procured a piece of land in
Taiwan (roughly one acre) in anticipation of its third plant. Exact capacity of this plant is yet to be determined, as management is indicating plans to scale the facility vertically to boost gross capacity (adding more floors). Note, plant 1 and plant 2 are about 4.2 and 4.6 acres respectively. However, as mentioned, it is difficult to model FRCB’s earnings bottom-up based on operational indicators like capacity or floor space. With a vertical design, the gross floor space could be much higher, allowing for capacity to match or even exceed plant 1. Timeline for construction of this plant is about 1.5-2 years, which would put the next surge in capacity at round 2027 onwards.
Chart 18: FRCB's revenue vs TSMC's Capex
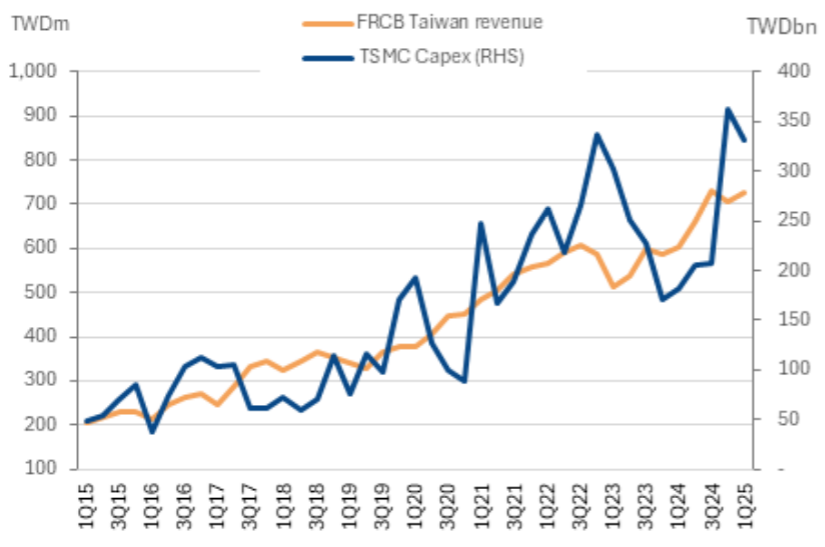
Chart 19: TSMC capex outlook: +15% CAGR
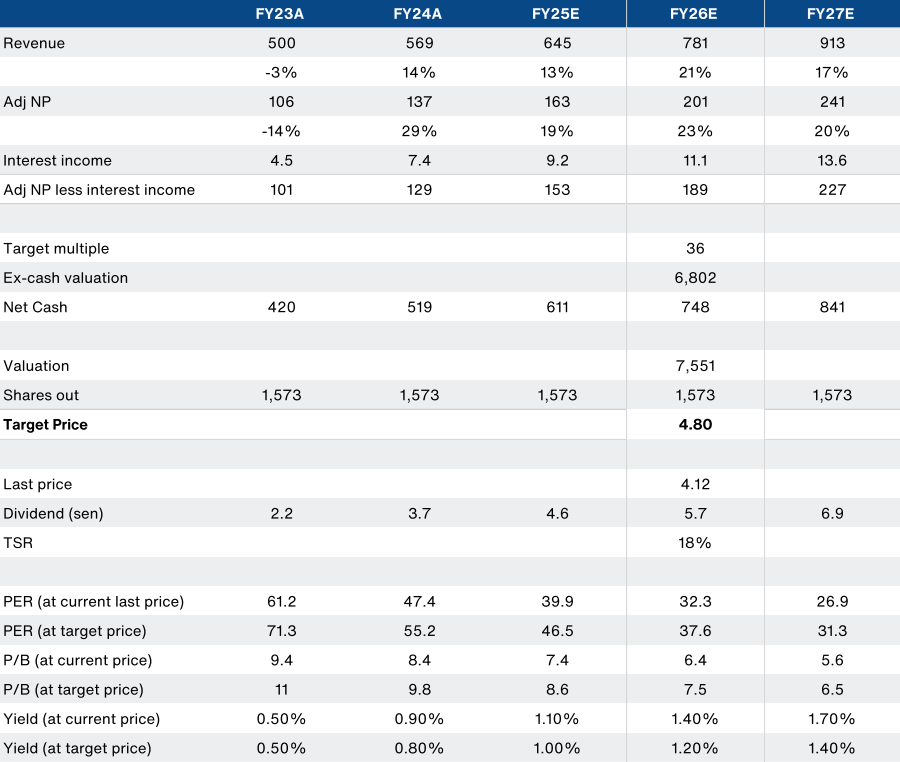
Valuations:
We value Frontken at 36x multiple on FY26E pre-cash earnings, for a target price of RM4.80. This implies a multiple of 37.6x FY26E earnings, which is +2StdDev of the trailing 3yr average PER. However, this is only +0.6StdDEv vs the LT average.
We think the high implied multiple is justified, given:
- FRCB will outperform the sector’s earnings delivery in the ST; excluding one-offs.
- FRCB has a higher quality and more sustainable secular driver to earnings.
- FRCB could displace INRI as the de-facto flagship tech stock of the sector.
Chart 20: Valuation methodology
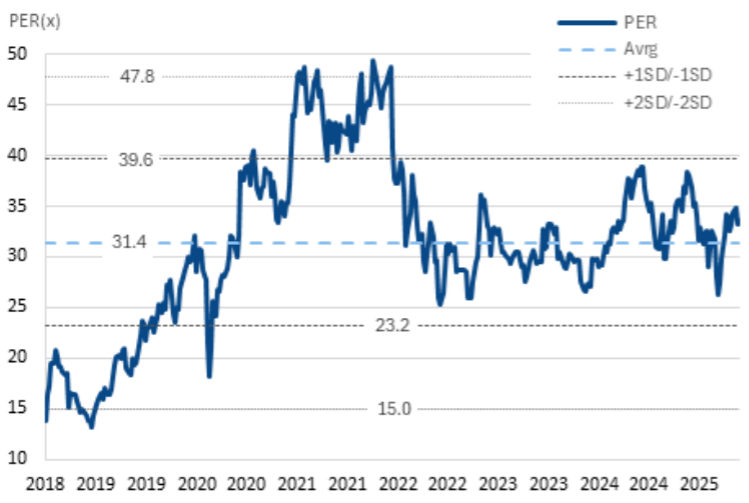
Looking at Frontken’s long-run PER bands, we anticipate that this might not be a fair benchmark. Prior to 2019, Frontken’s exposure to TSMC was not fully appreciated and thus not reflected in the valuations. Then in 2020-2022, the unique circumstances of the pandemic pushed overall sector valuations to super-cyclical highs. Without similar factors on the horizon, we think this period may not be representative either.
Chart 21: Long-run PER bands
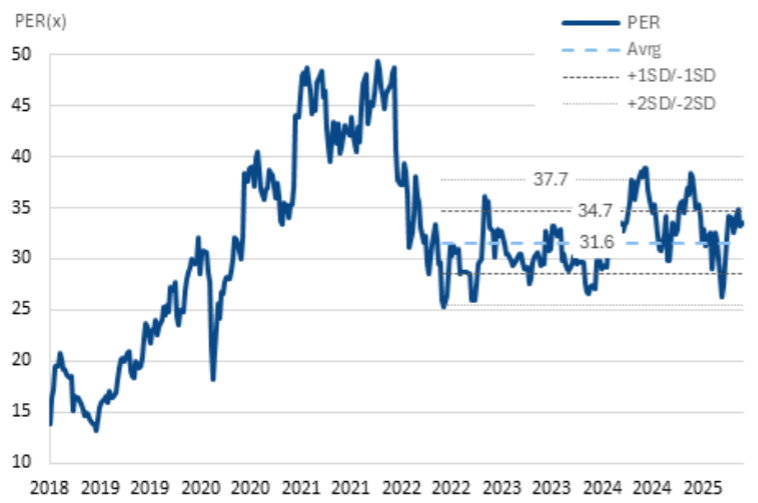
Instead, we look to the trailing 3-yr PER band, with an average PER of 31.6x (12M
blended forward) as the benchmark to for FRCB’s valuations. As articulated, we think FRCB is justified to trade at the high end of this band, given its quality earnings outlook, coupled with the potential to climb a rung or two to become the sector flagship benchmark going forward.
Chart 22: Post-pandemic valuation bands
Bull case valuation:
FRCB has the opportunity to follow its key customer, TSMC, for overseas expansion. Critically, FRCB could opt for a low-risk, low-capex model, where it works with a domestic partner onshore and charge royalties for rights to its intellectual property on cleaning processes.
TSMC is in the process of investing US$65bn into a new plant in Arizona, USA, as the first phase of a US$165bn investment plan. FRCB has three main options.
- Firstly, it can support its customer remotely. Flying tooling back and forth from Taiwan for cleaning. This works for low volumes, and we believe that some work could already be underway in this manner.
- Secondly, FRCB can opt to set up a facility in the US to support TSMC. This would be somewhat capital intensive and may run at a loss initially under TSMC ramps up volumes. This would be the riskiest option.
- Lastly, FRCB could tie up with a local partner and charge royalties on for its
cleaning processes that are already qualified with TSMC. We see this as the most attractive option.
TSMC is also expanding in Singapore via its affiliate, Vanguard with a US$7.8bn plant. While smaller in scale, this would be much closer to home and FRCB would be able to support Vanguard with similar options mentioned above. Initial reports suggest this plant will fabricate older nodes as well. Coupled with the smaller scale of investment, we anticipate this opportunity will be less meaningful for FRCB.
In both cases, we think crystallization of a venture abroad would be a catalyst for
FRCB’s valuations – proving that its business model is able to scale with TSMC’s
evolving global footprint.
Our bull case valuation is RM6.00 on 37x an upgraded FY27E Adj NP of RM250m (+5%). Given the earnings catalysts we mentioned are pushed out to FY27 at least, we use the 2-yr forward multiple for our bull cash assumptions. But even applying a 11% discount, it would translate to a fair value of RM5.35 for FY26