Just charts: The US-Iran war
Trends to track.
Key takeaways:
- The potential ending of the ceasefire on 22nd April will be the next risk junction for potential escalation in hostilities.
- Latest enforcement of blockades marks an inflection in the de-escalation bias that emerged from the ceasefire.
Latest updates:
- The ceasefire is scheduled to end on April 22nd and negotiations are ongoing.
- The US fired-upon and seized an Iranian flagged container vessel, Touska, that was returning from China.
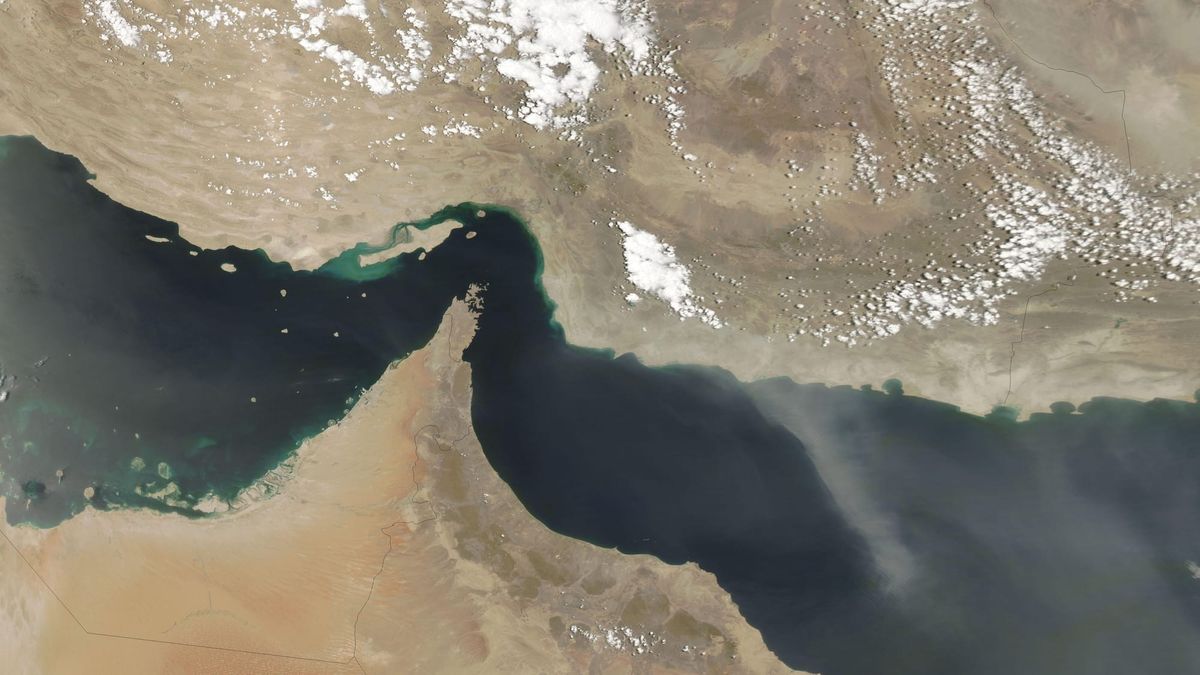
- Iran fired upon several merchant vessels, effectively closing the Strait of Hormuz.
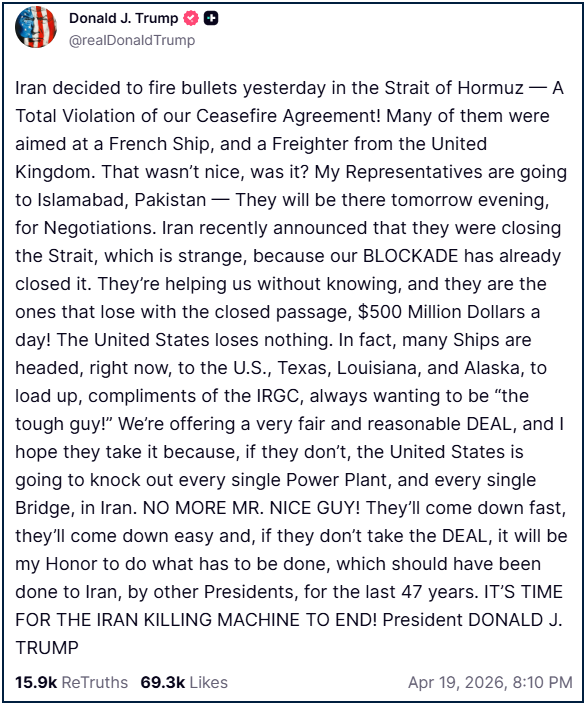
From the Whitehouse: "No MORE MR. NICE GUY".
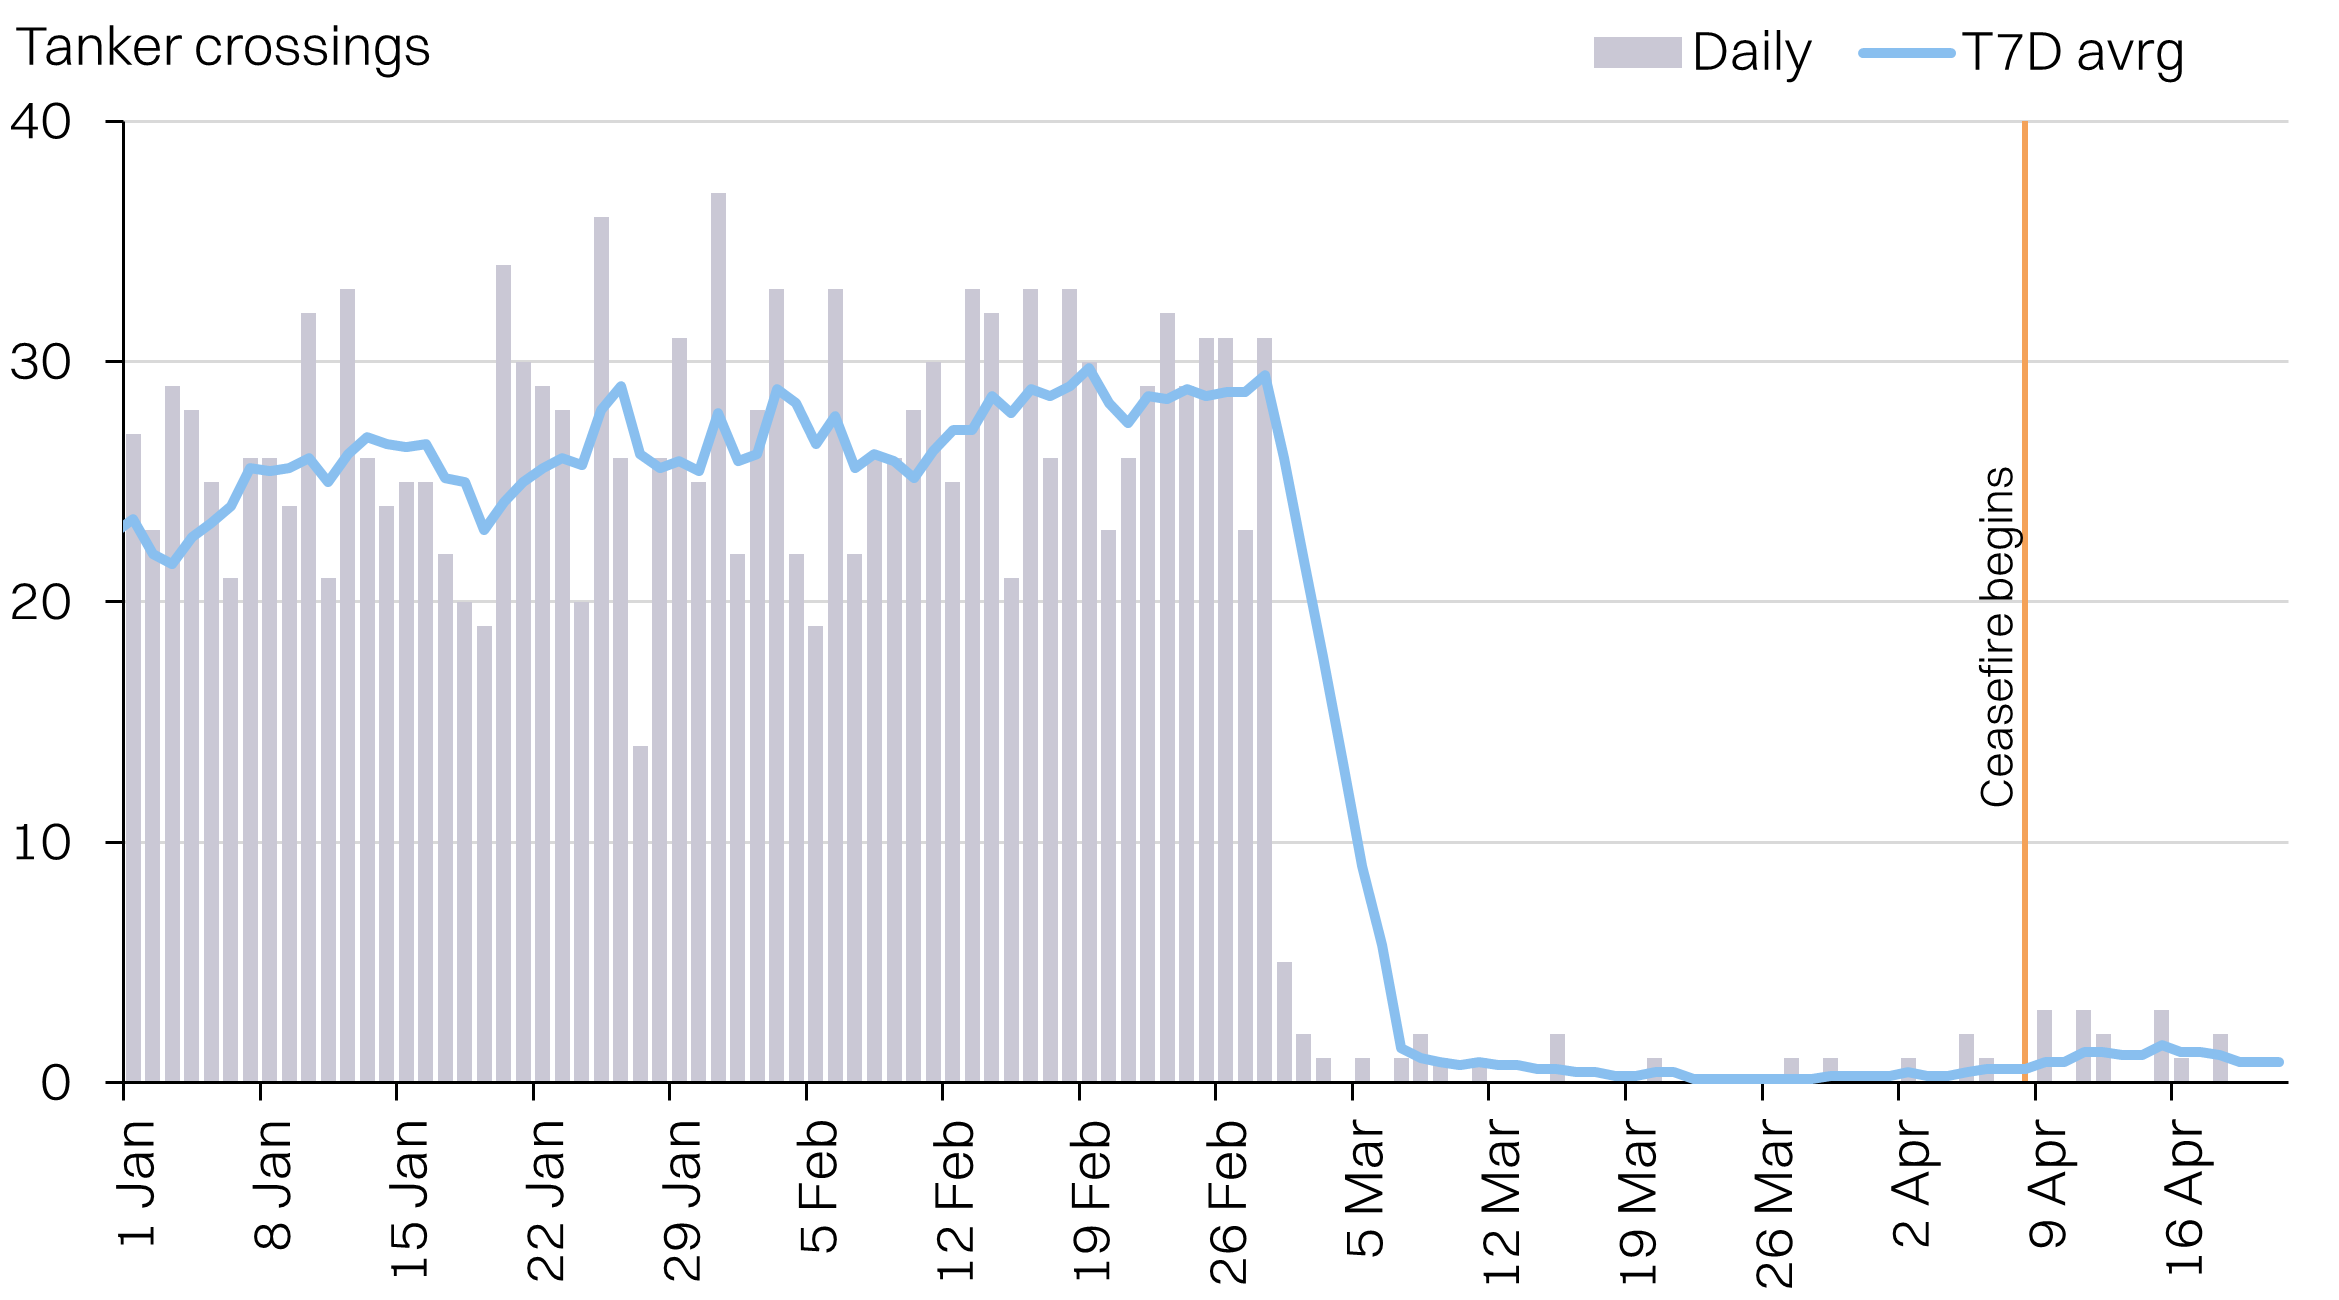
Tanker crossings: 14 tankers transited during the ceasefire
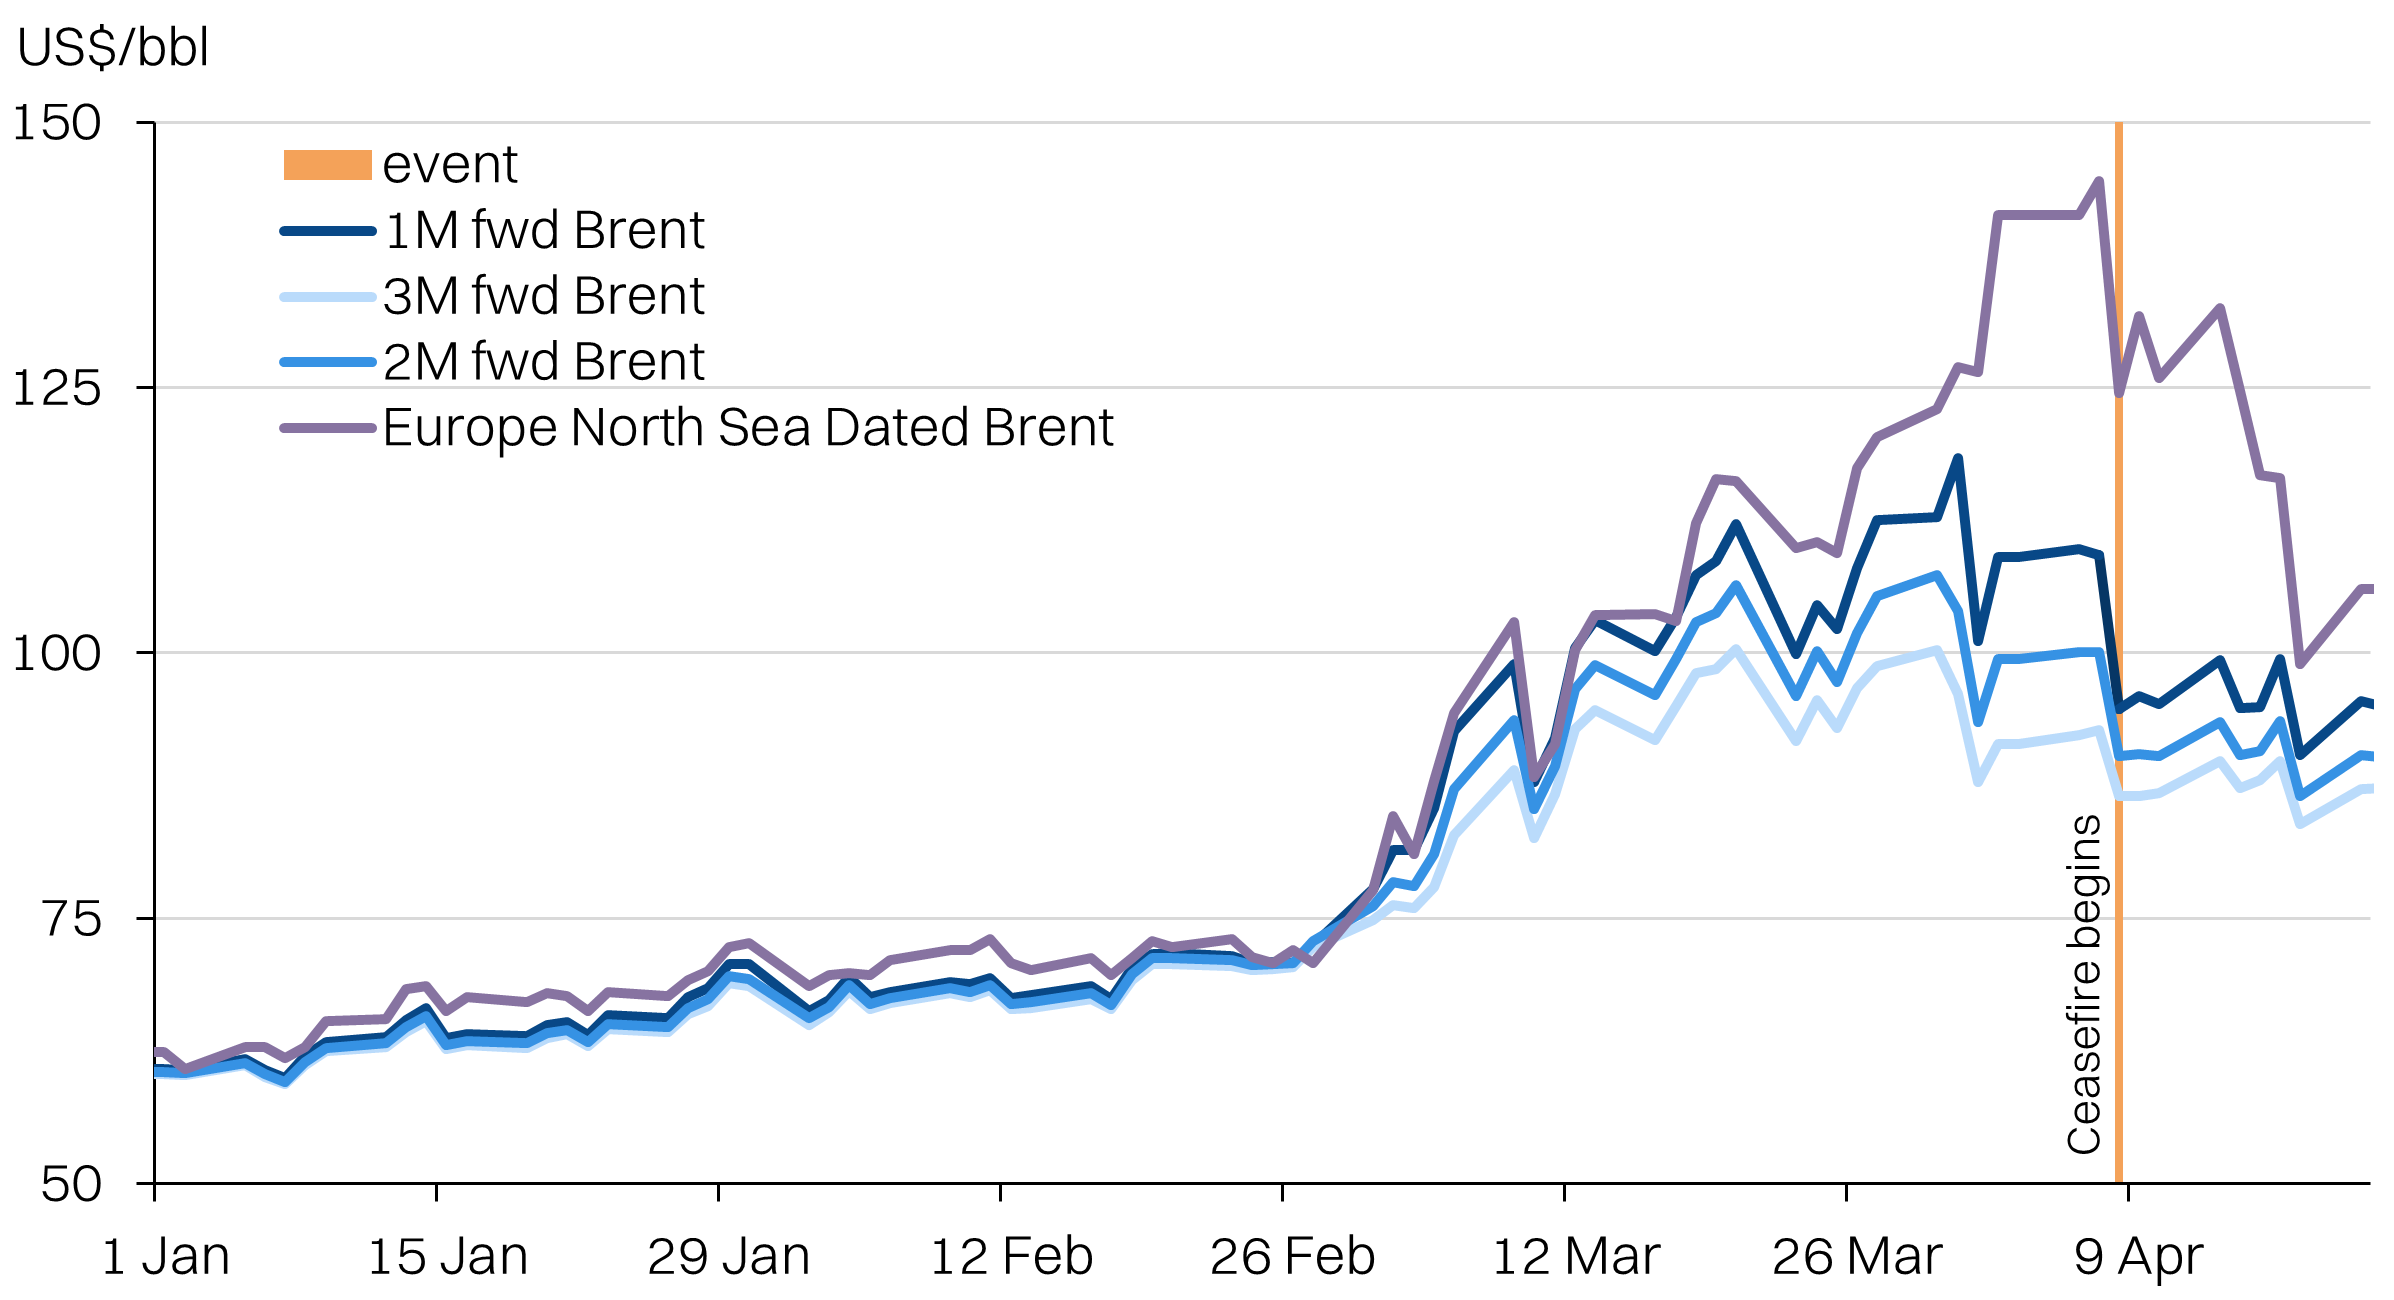
Crude oil prices: ceasefire trimmed backwardation
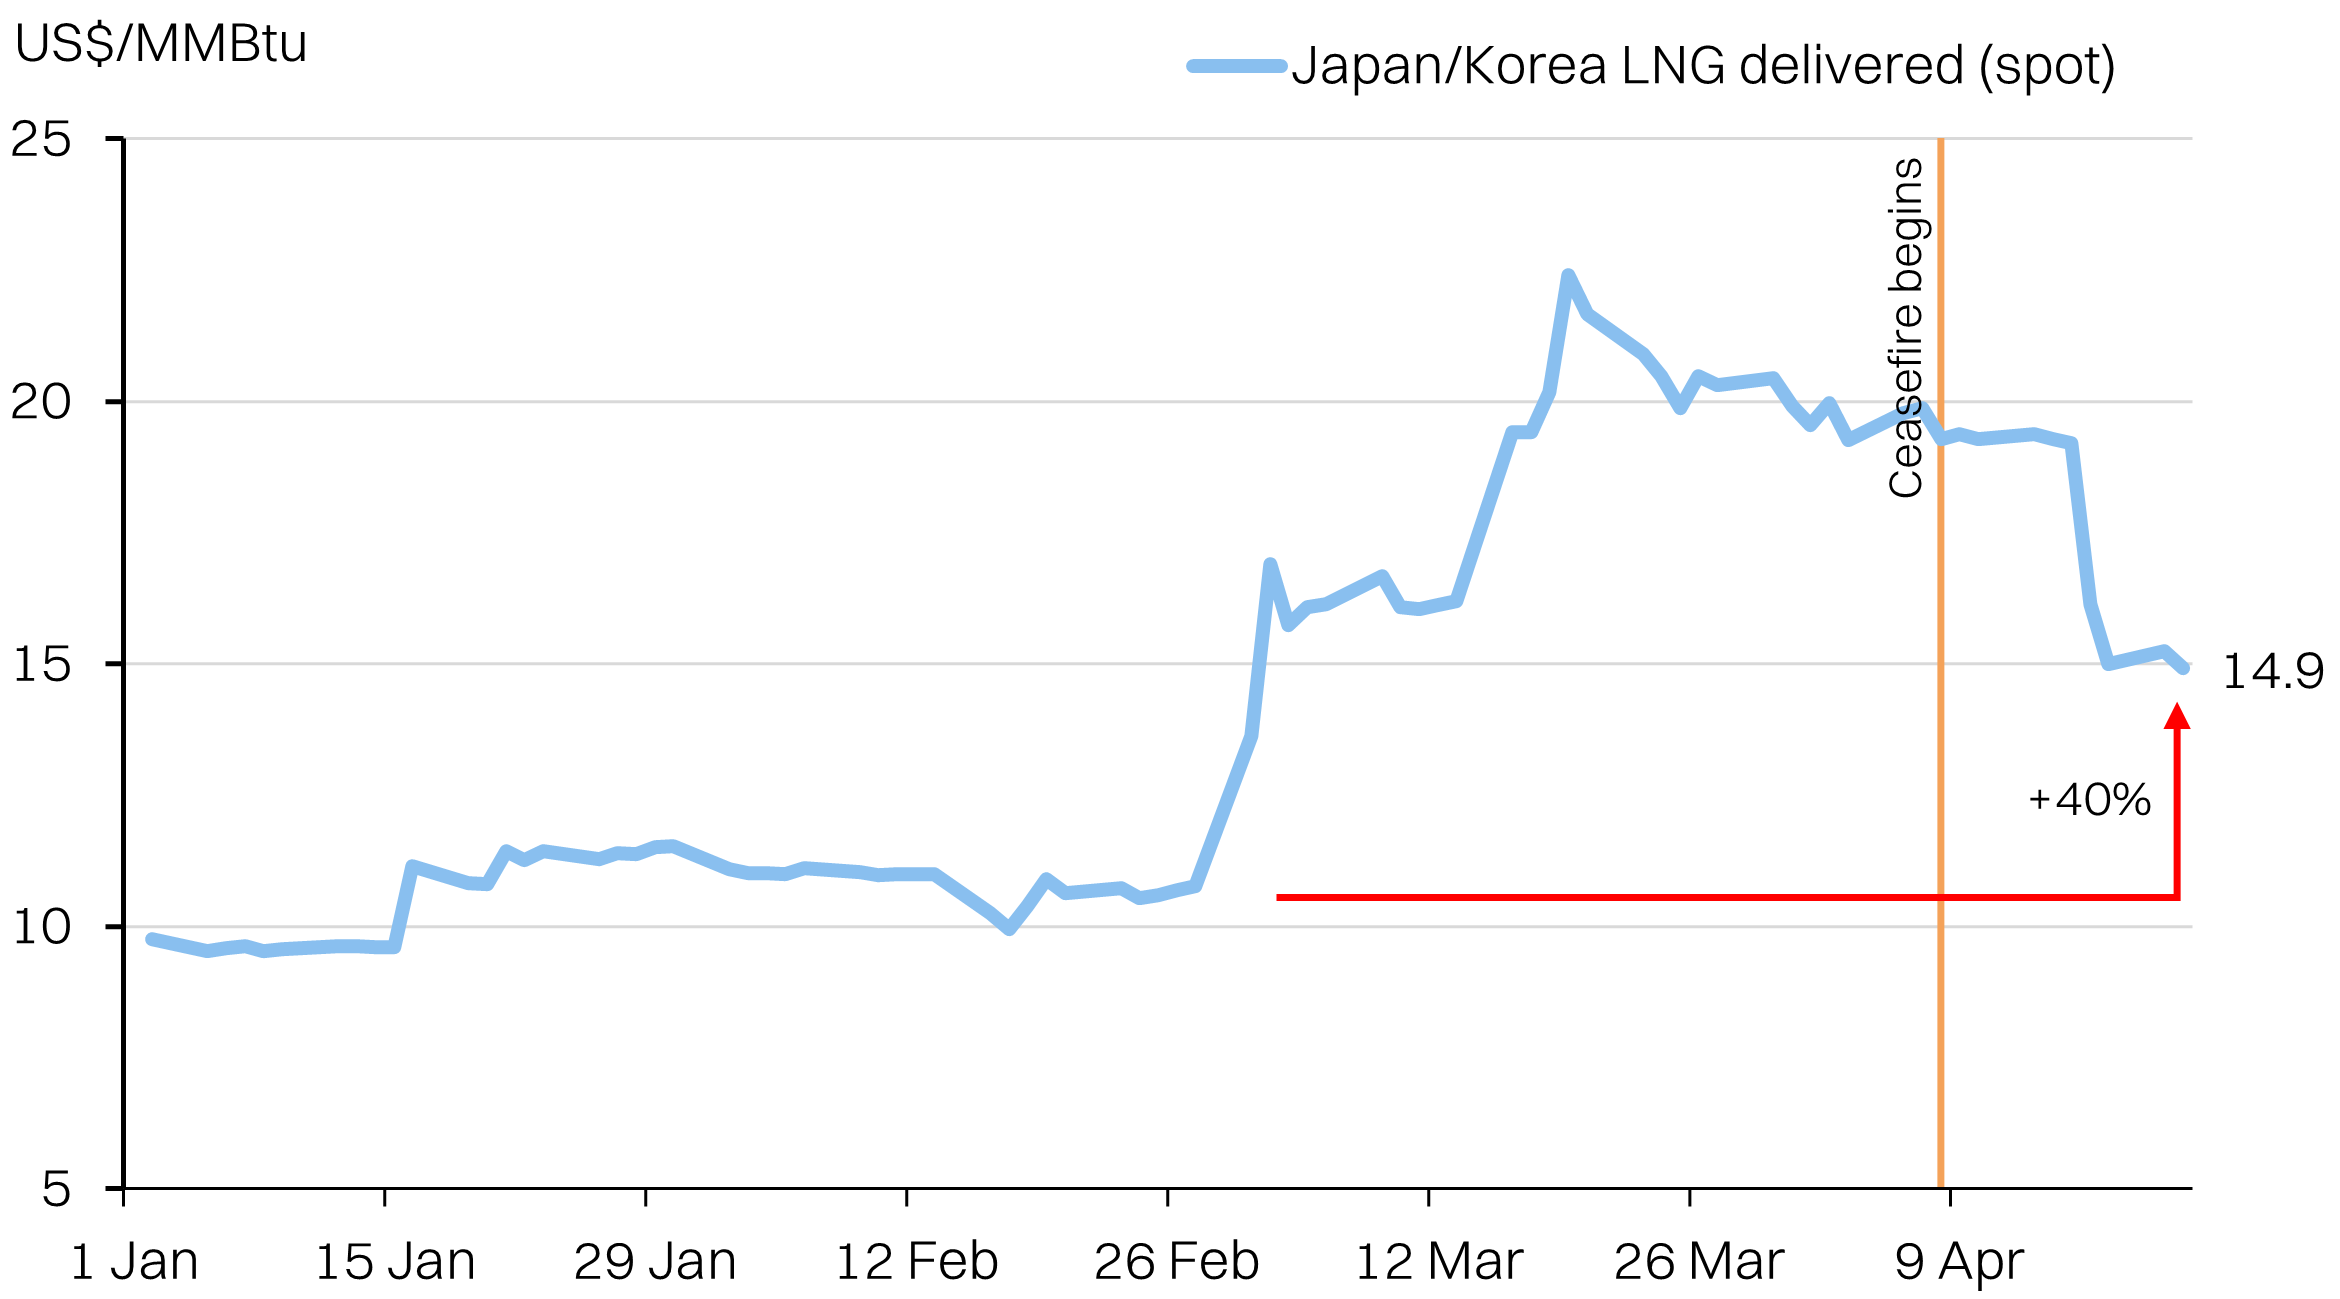
LNG prices: some cooling
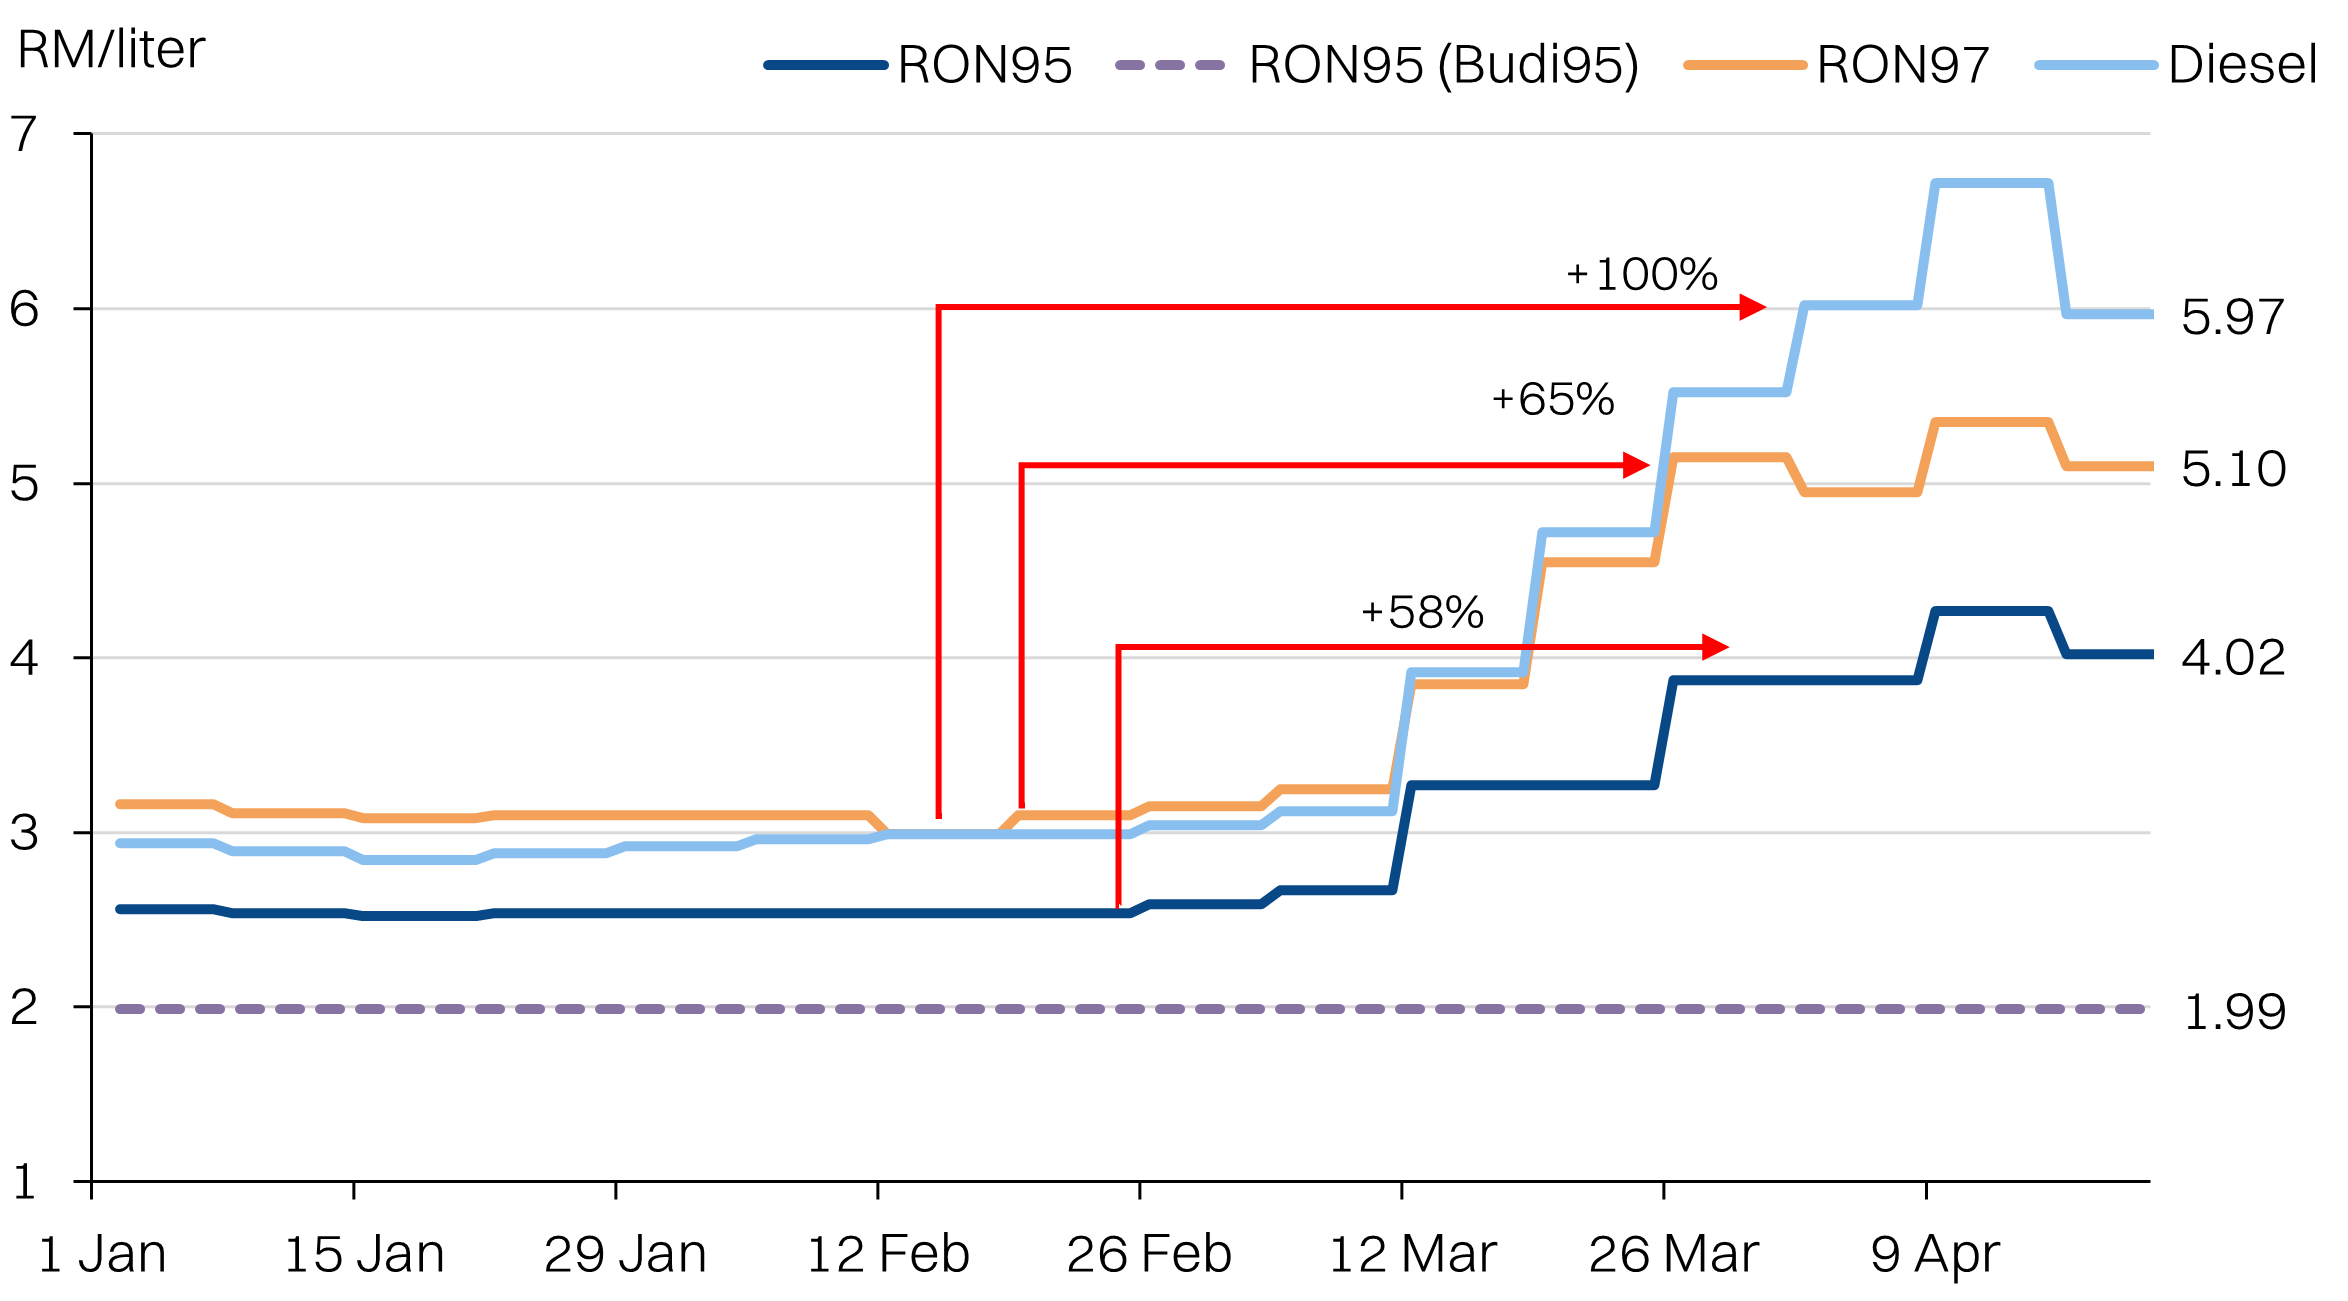
Malaysian pump prices: diesel more volatile
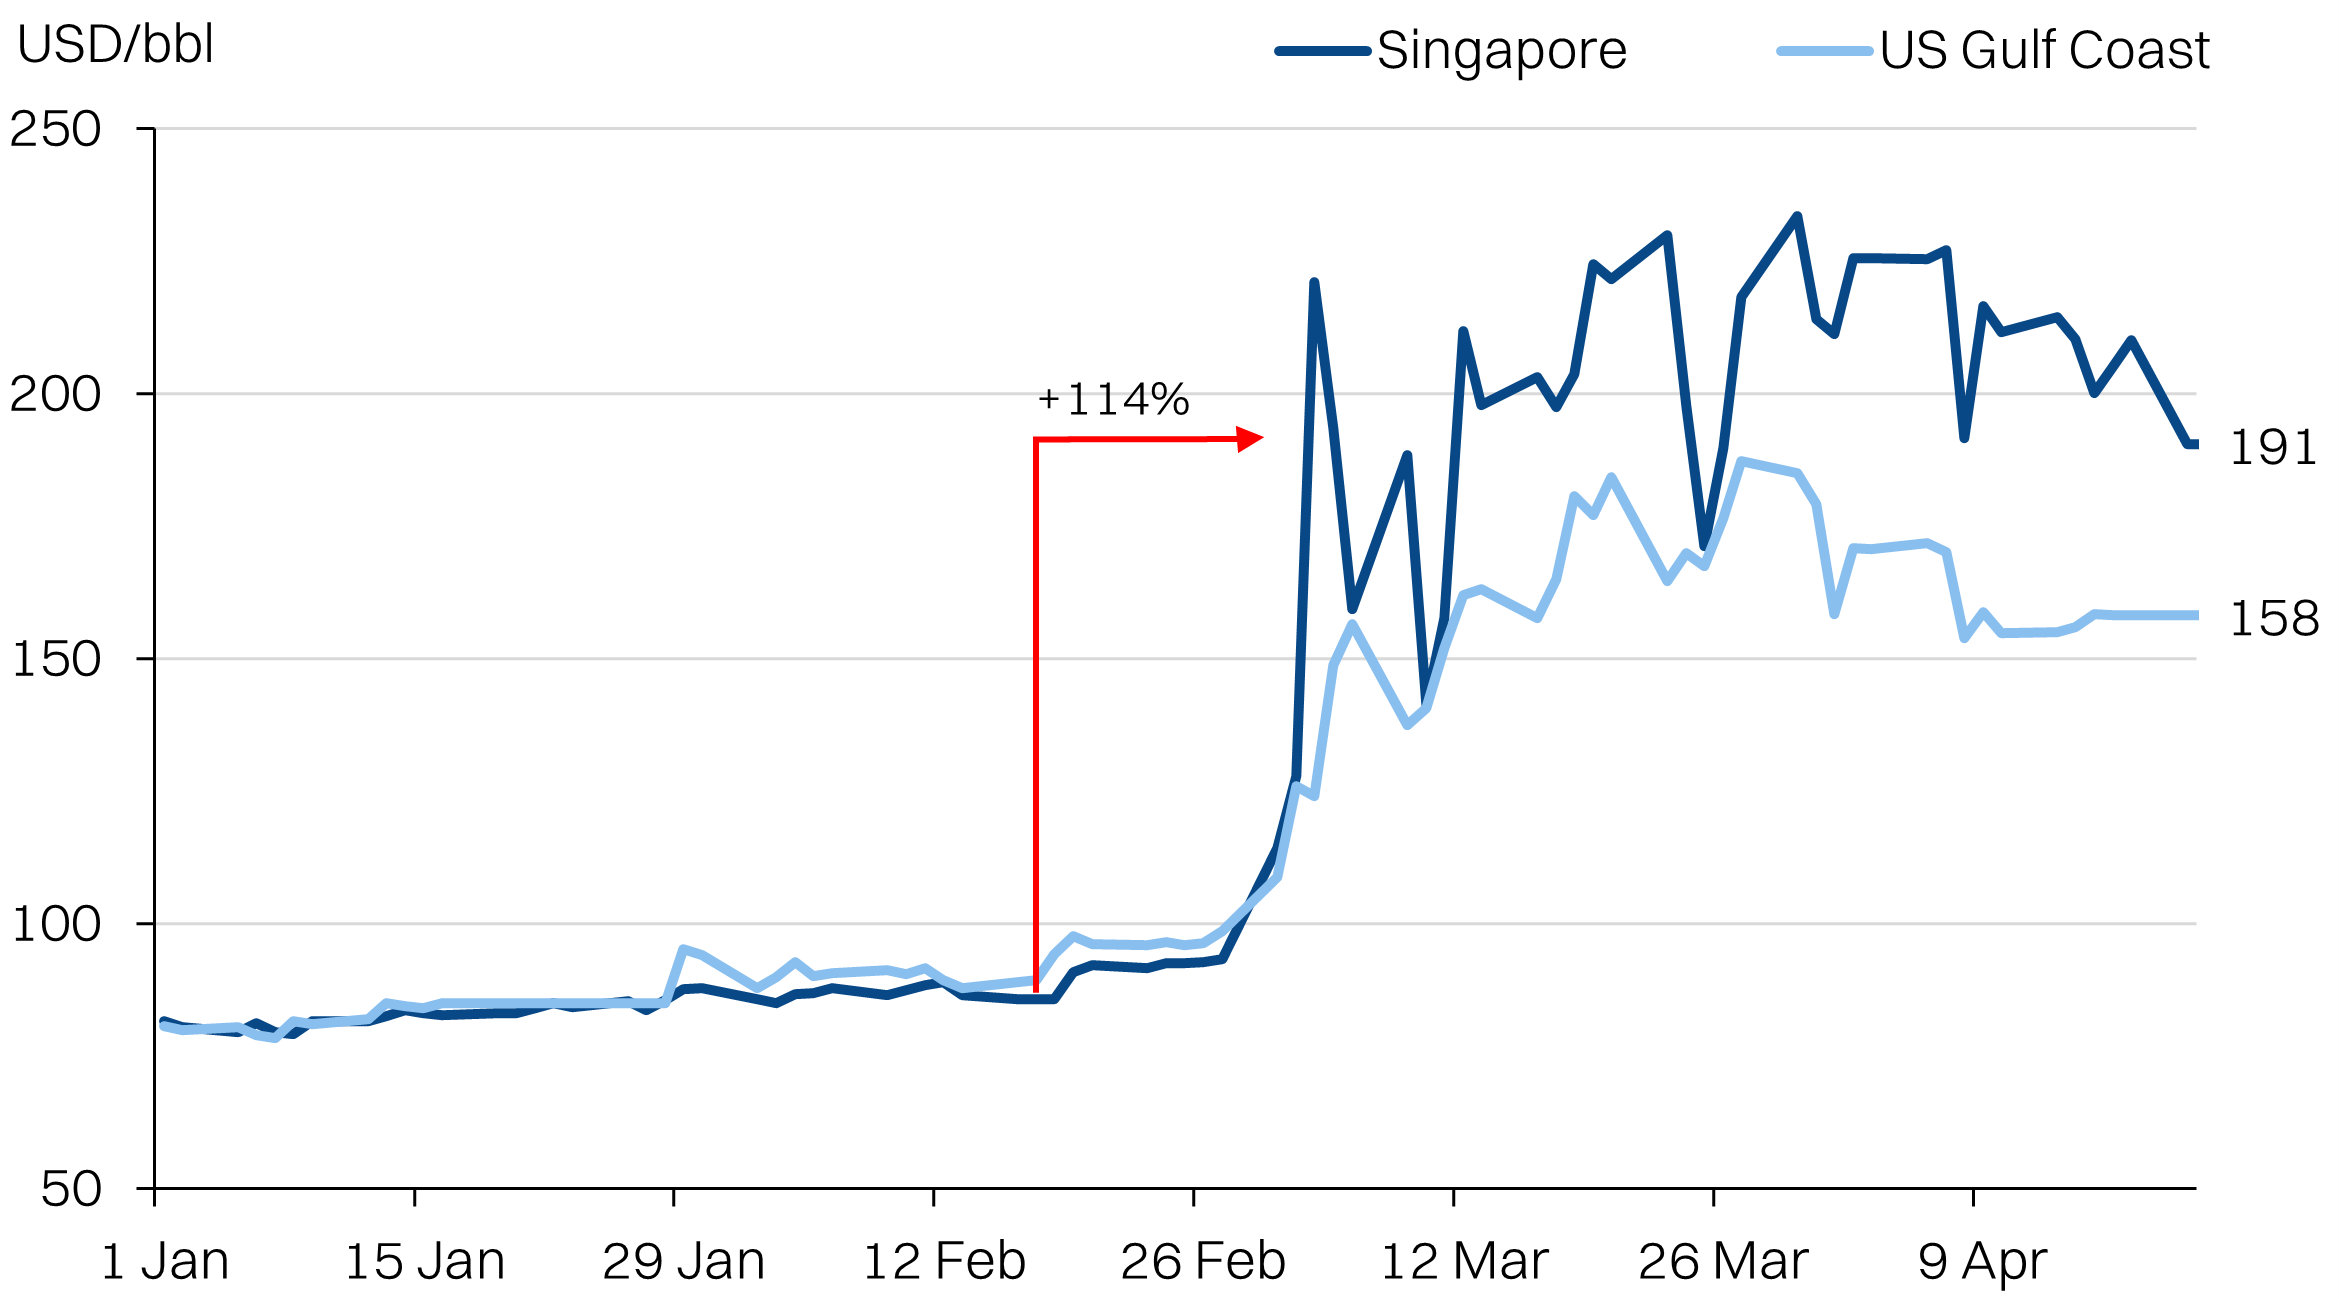
Jet fuel prices: more expensive in Asia
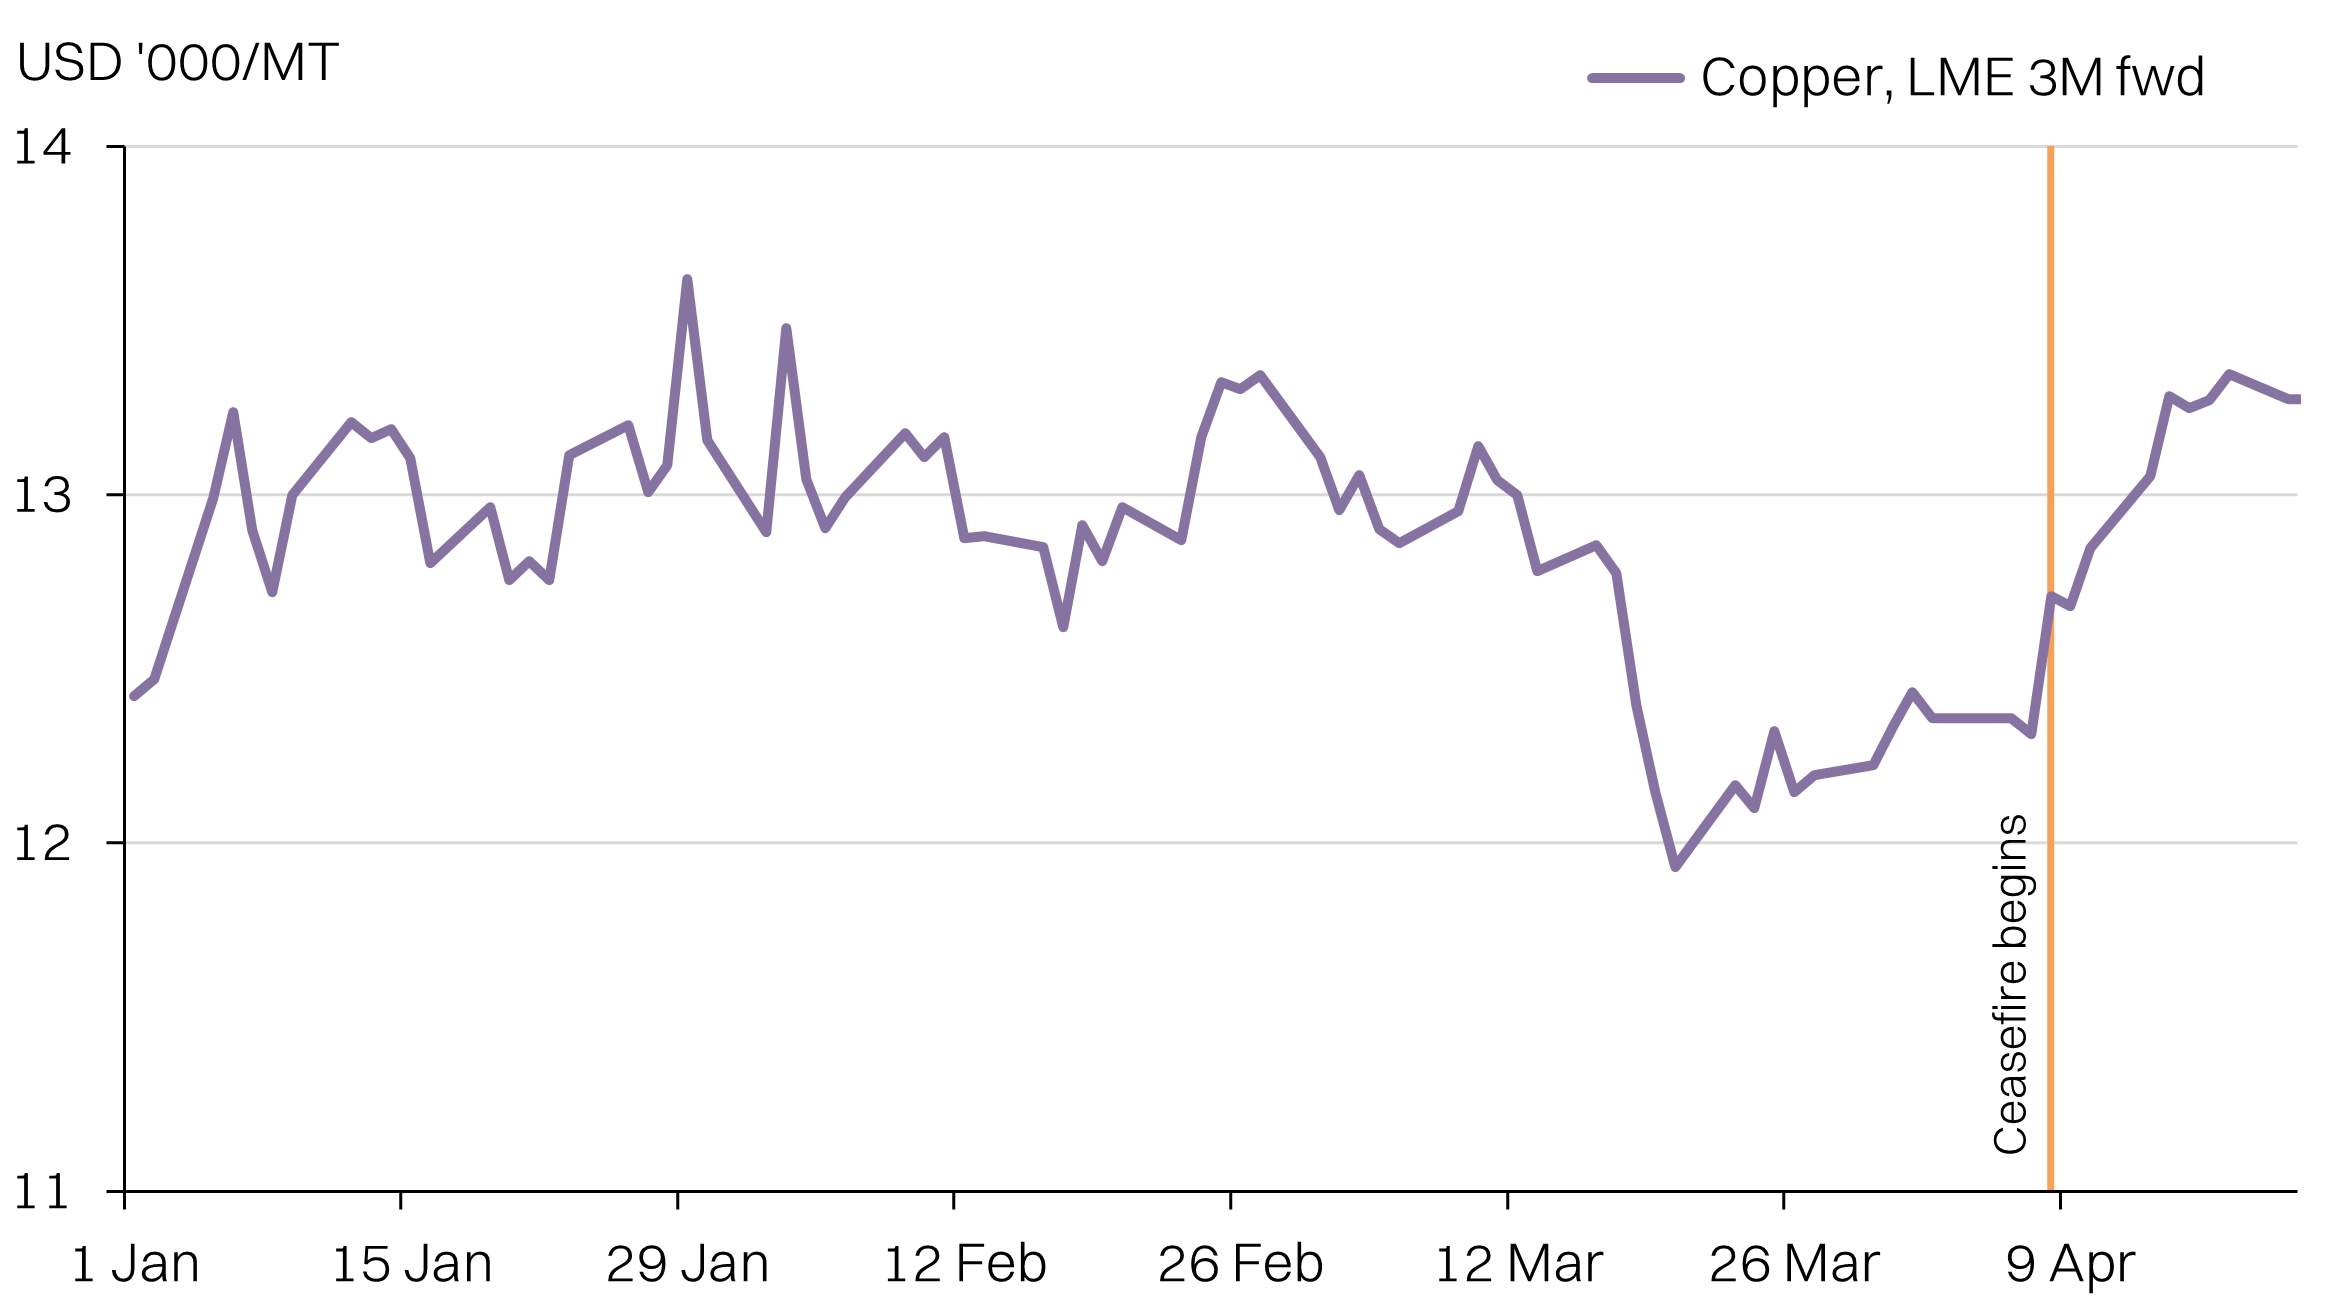
Copper: spurred by the ceasefire
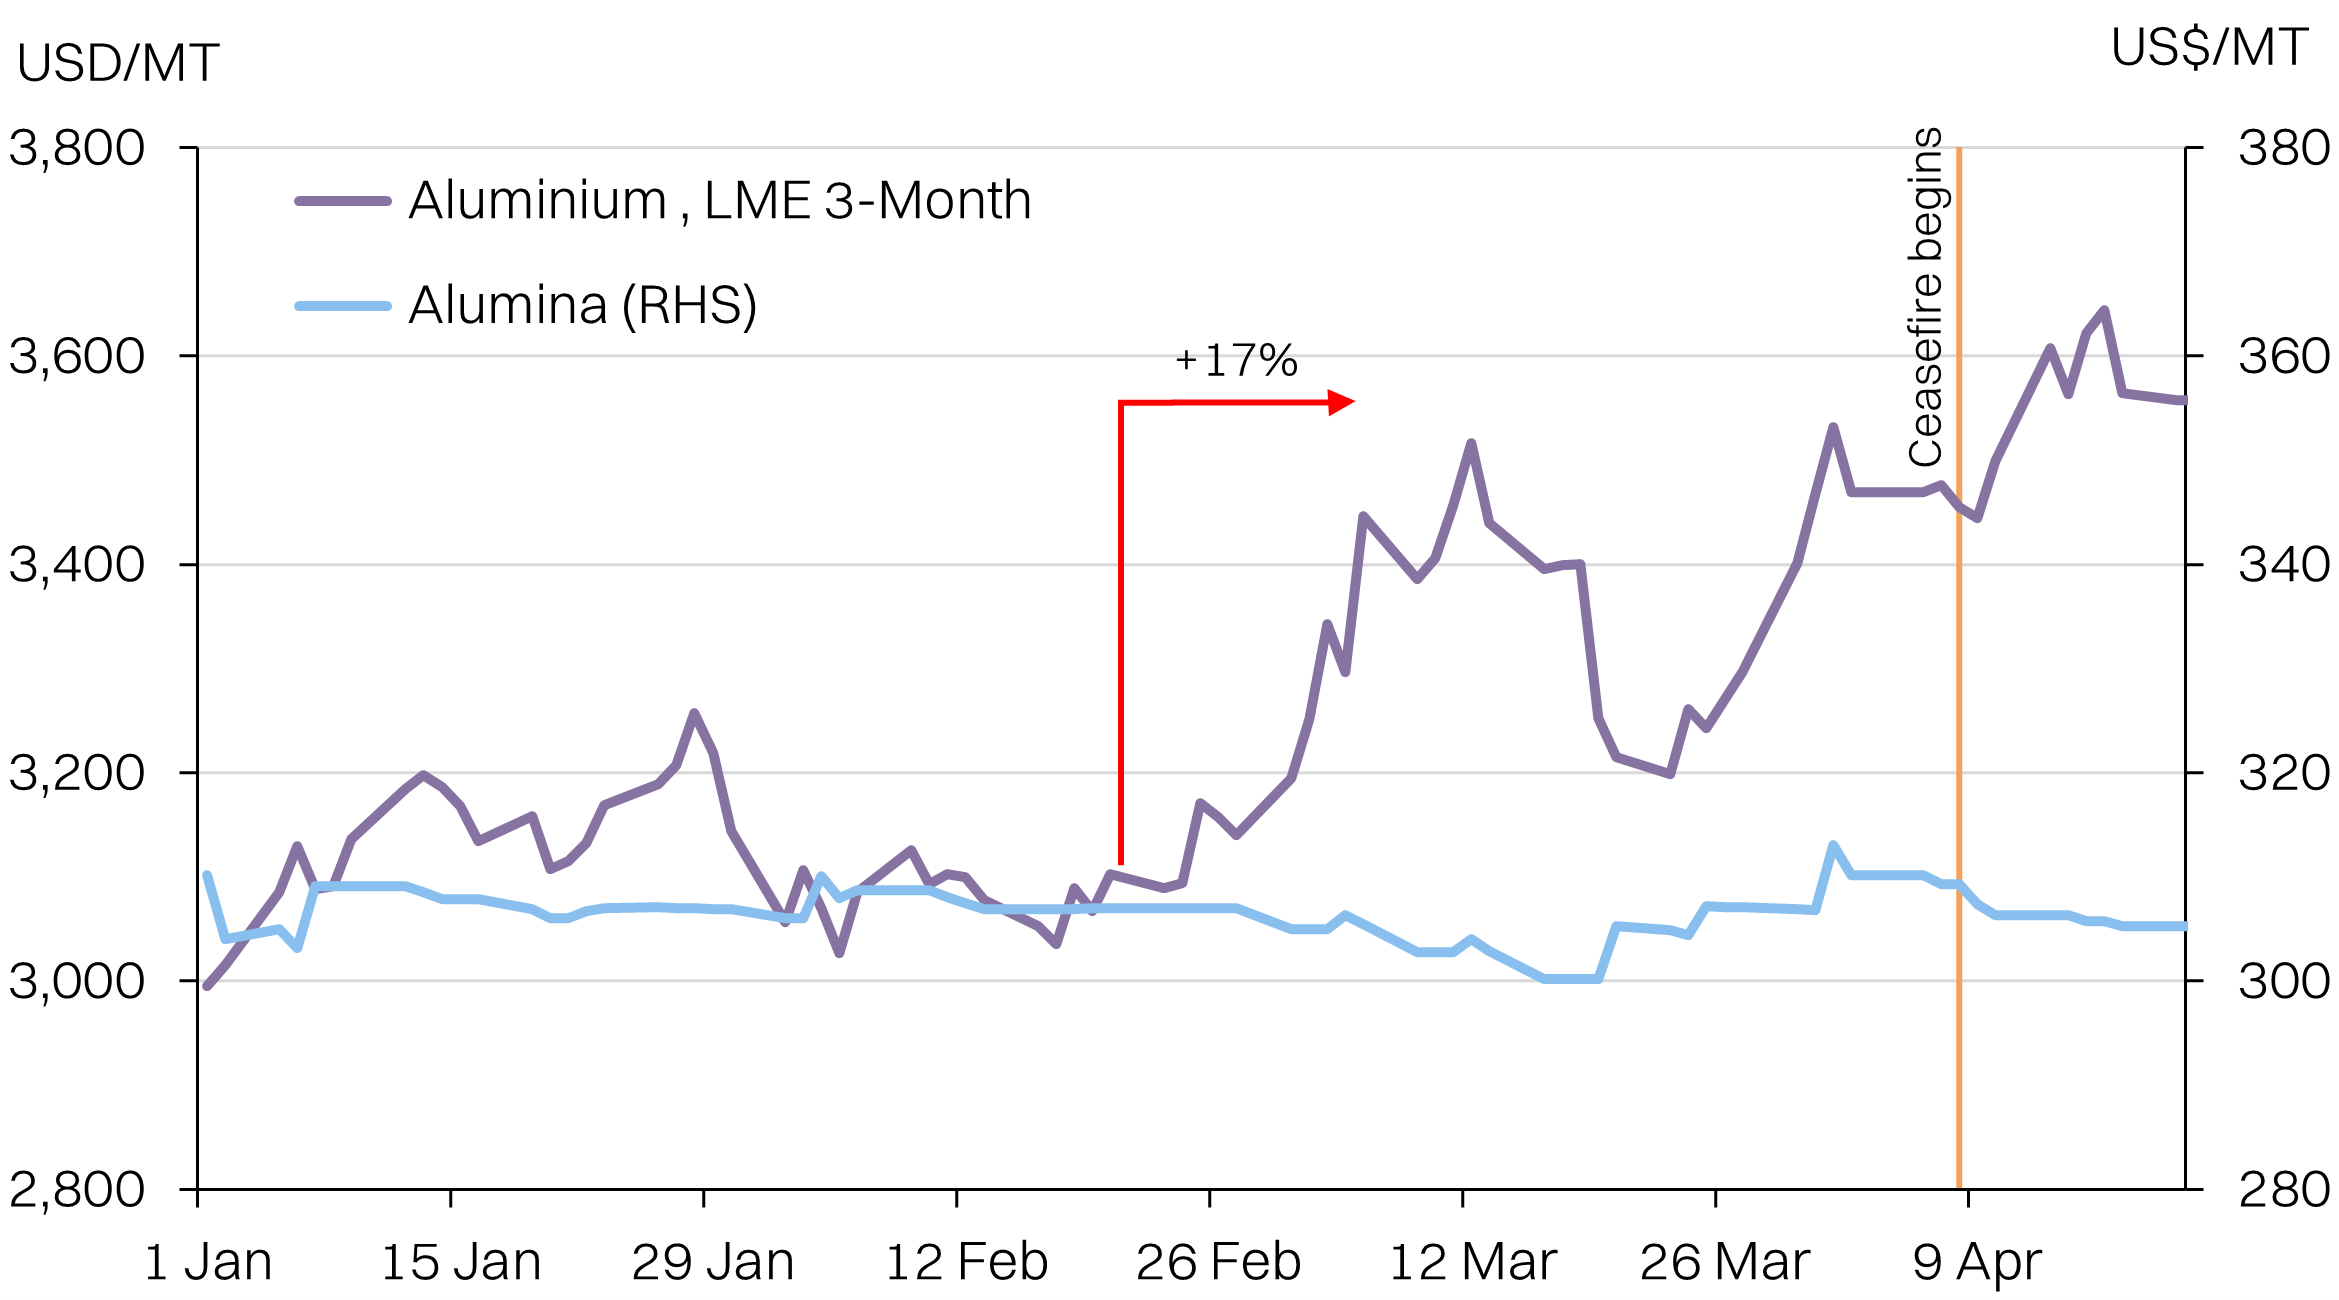
Aluminum: continues to rise
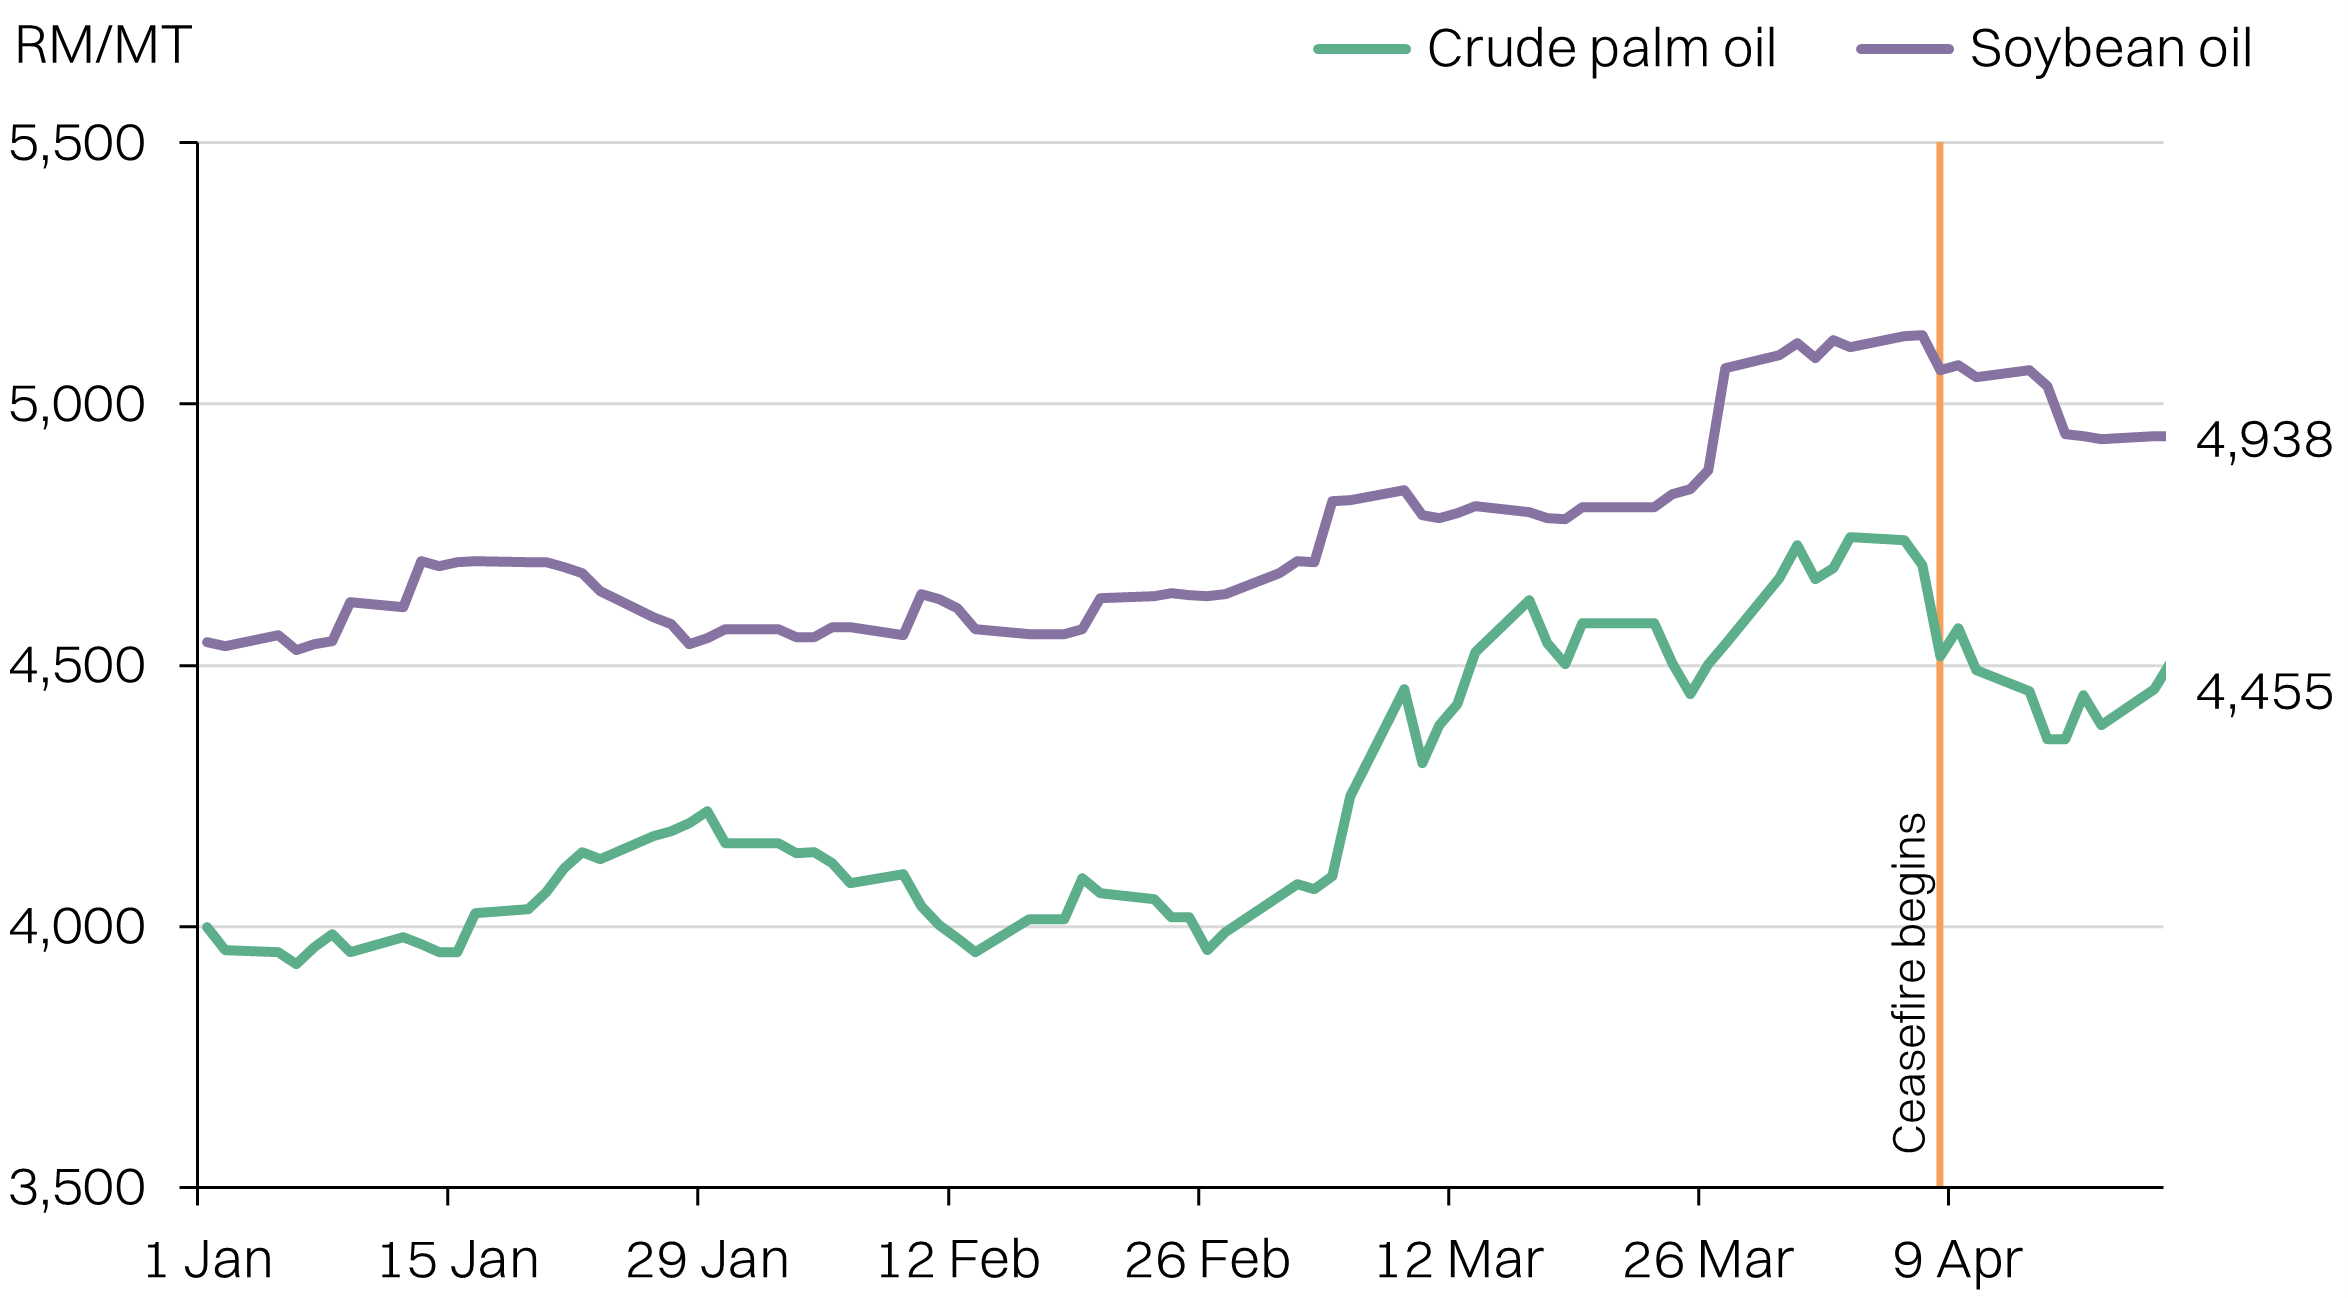
CPO vs SBO
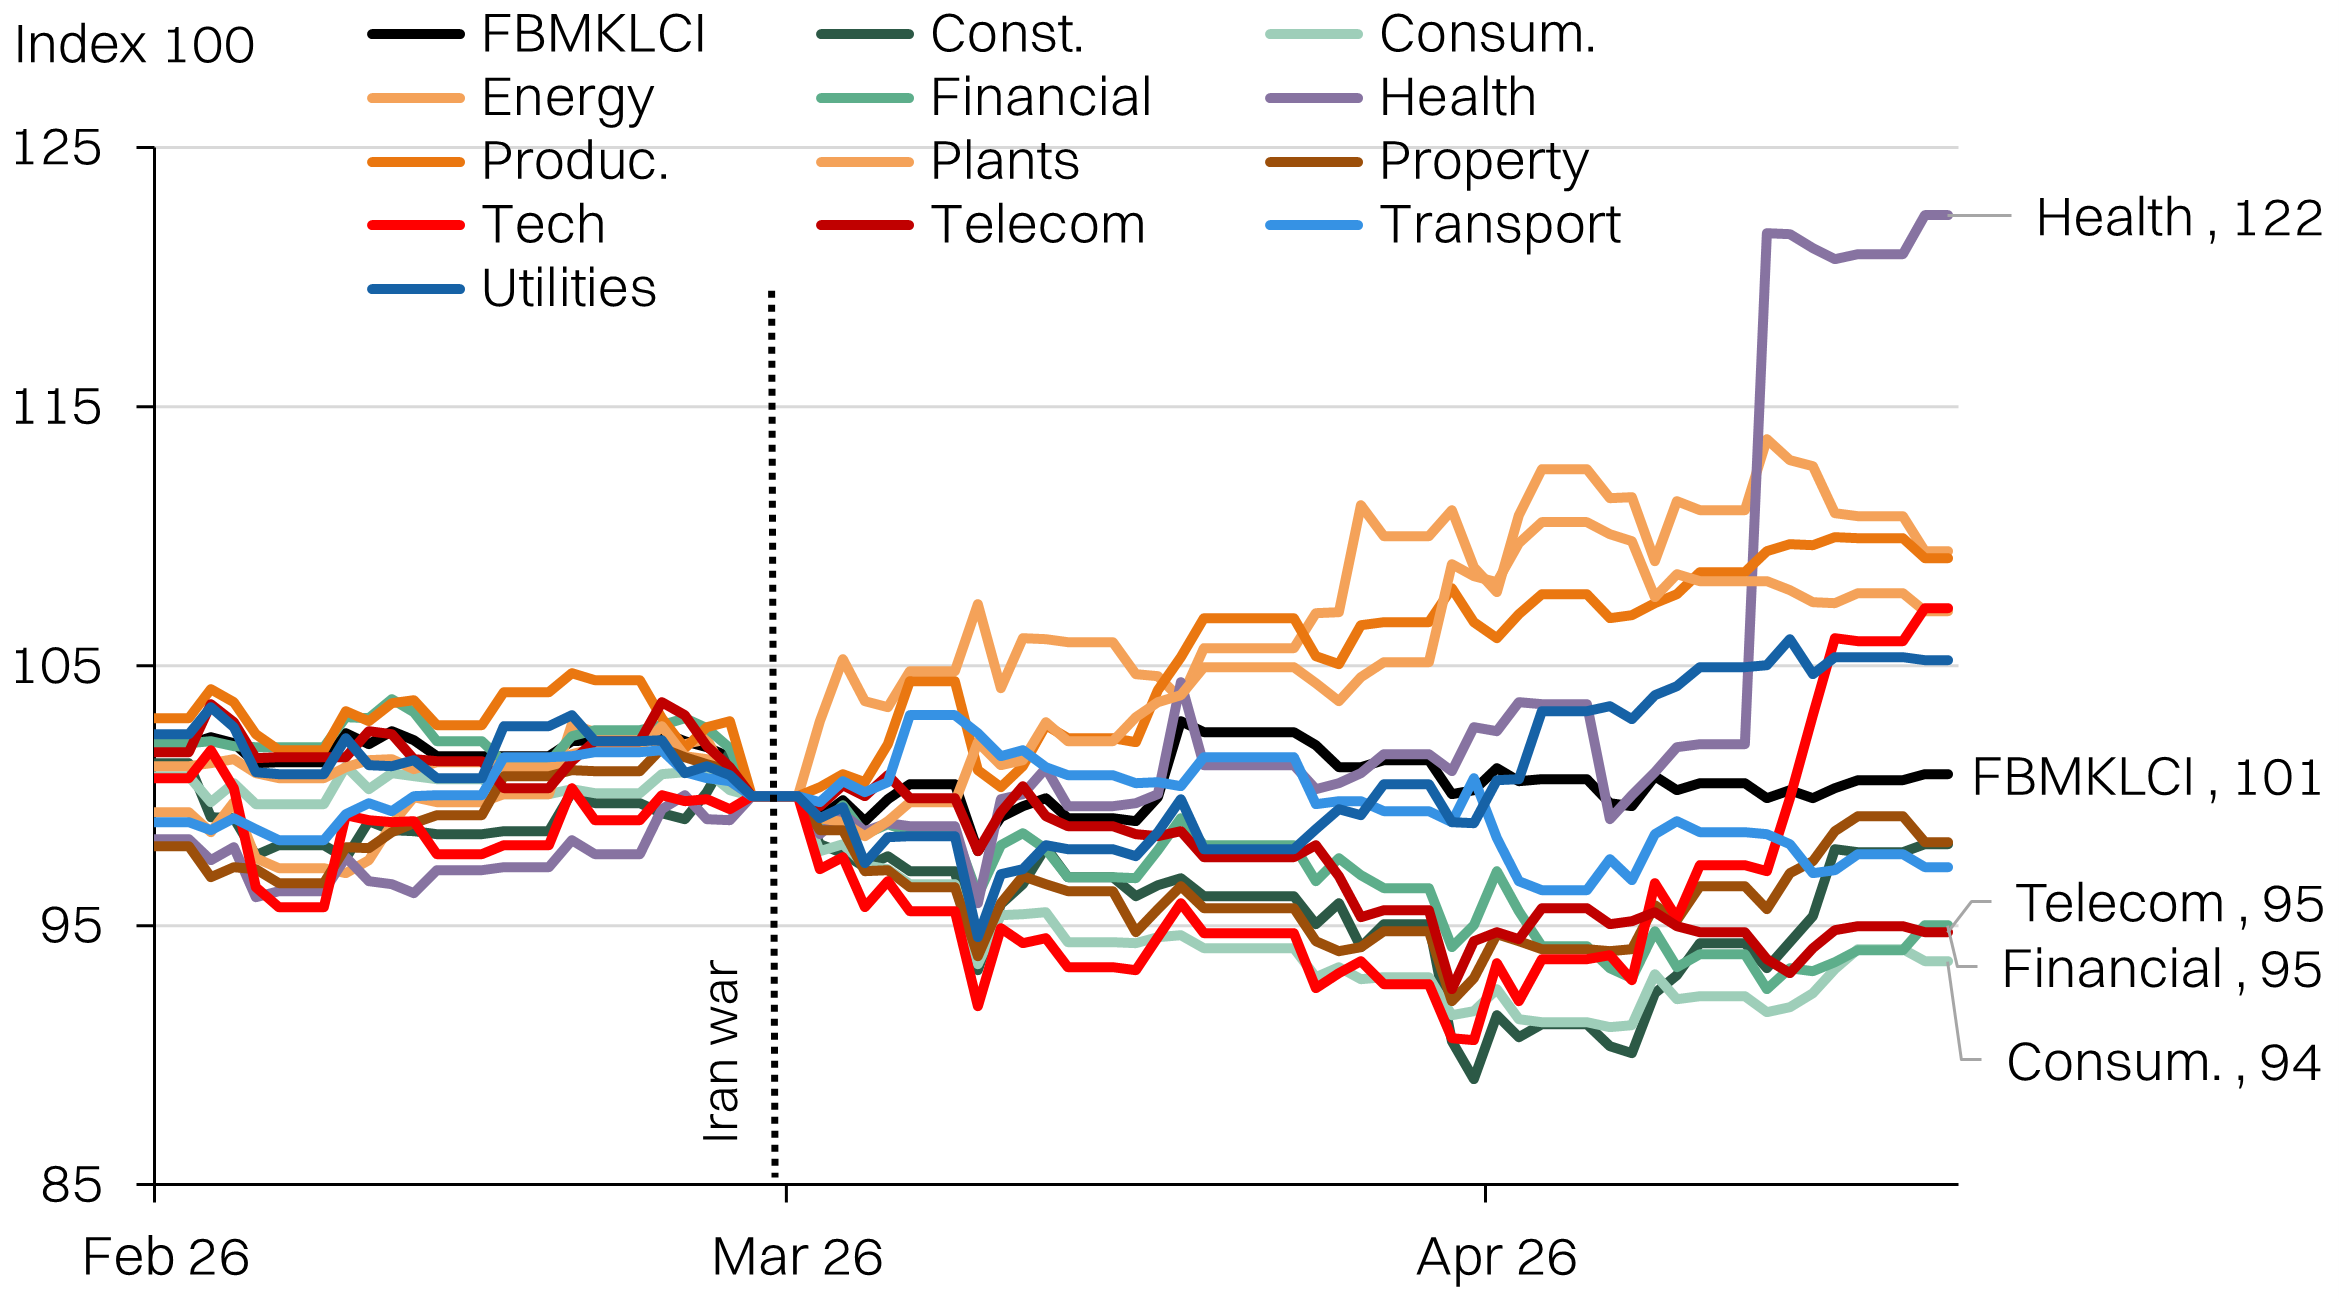
Sectoral indices: Defensives lagged - financials, telcos, consumer