Likely speedbumps for CPO’s windfall year
With CPO over RM4,500/MT, planters will have a windfall year. But what could temper the bullishness?
Malaysia Plantations
Disclaimer: By using this information, you acknowledge that you are solely responsible for evaluating the merits and risks of any investment decision and agree not to hold NewParadigm Research liable for any damages arising from such decisions.
Key Takeaways
- Two key headwinds for otherwise healthy CPO prices - methanol supply bottlenecks for Indonesian biodiesel and US farmers pivoting to soybeans to avoid high fertiliser costs.
- We anticipate CPO stabilising at ~RM4,500/MT with downside risk, especially if Iran war continues the deescalation bias.
- Preference for high yield planters with reasonable valuations and limit ed Indonesia exposure. JPG screens well within the sector.
CPO price vs plantations’ valuations / US planting: less corn, more soybean / Indonesia methanol imports: 19% at risk
Source: Bloomberg, NewParadigm Research, April 2026 / USDA, NewParadigm Research, April 2026 / UN Comtrade, WITS, GAPKI, NewParadigm Research, April 2026
Middle East Methanol bottleneck
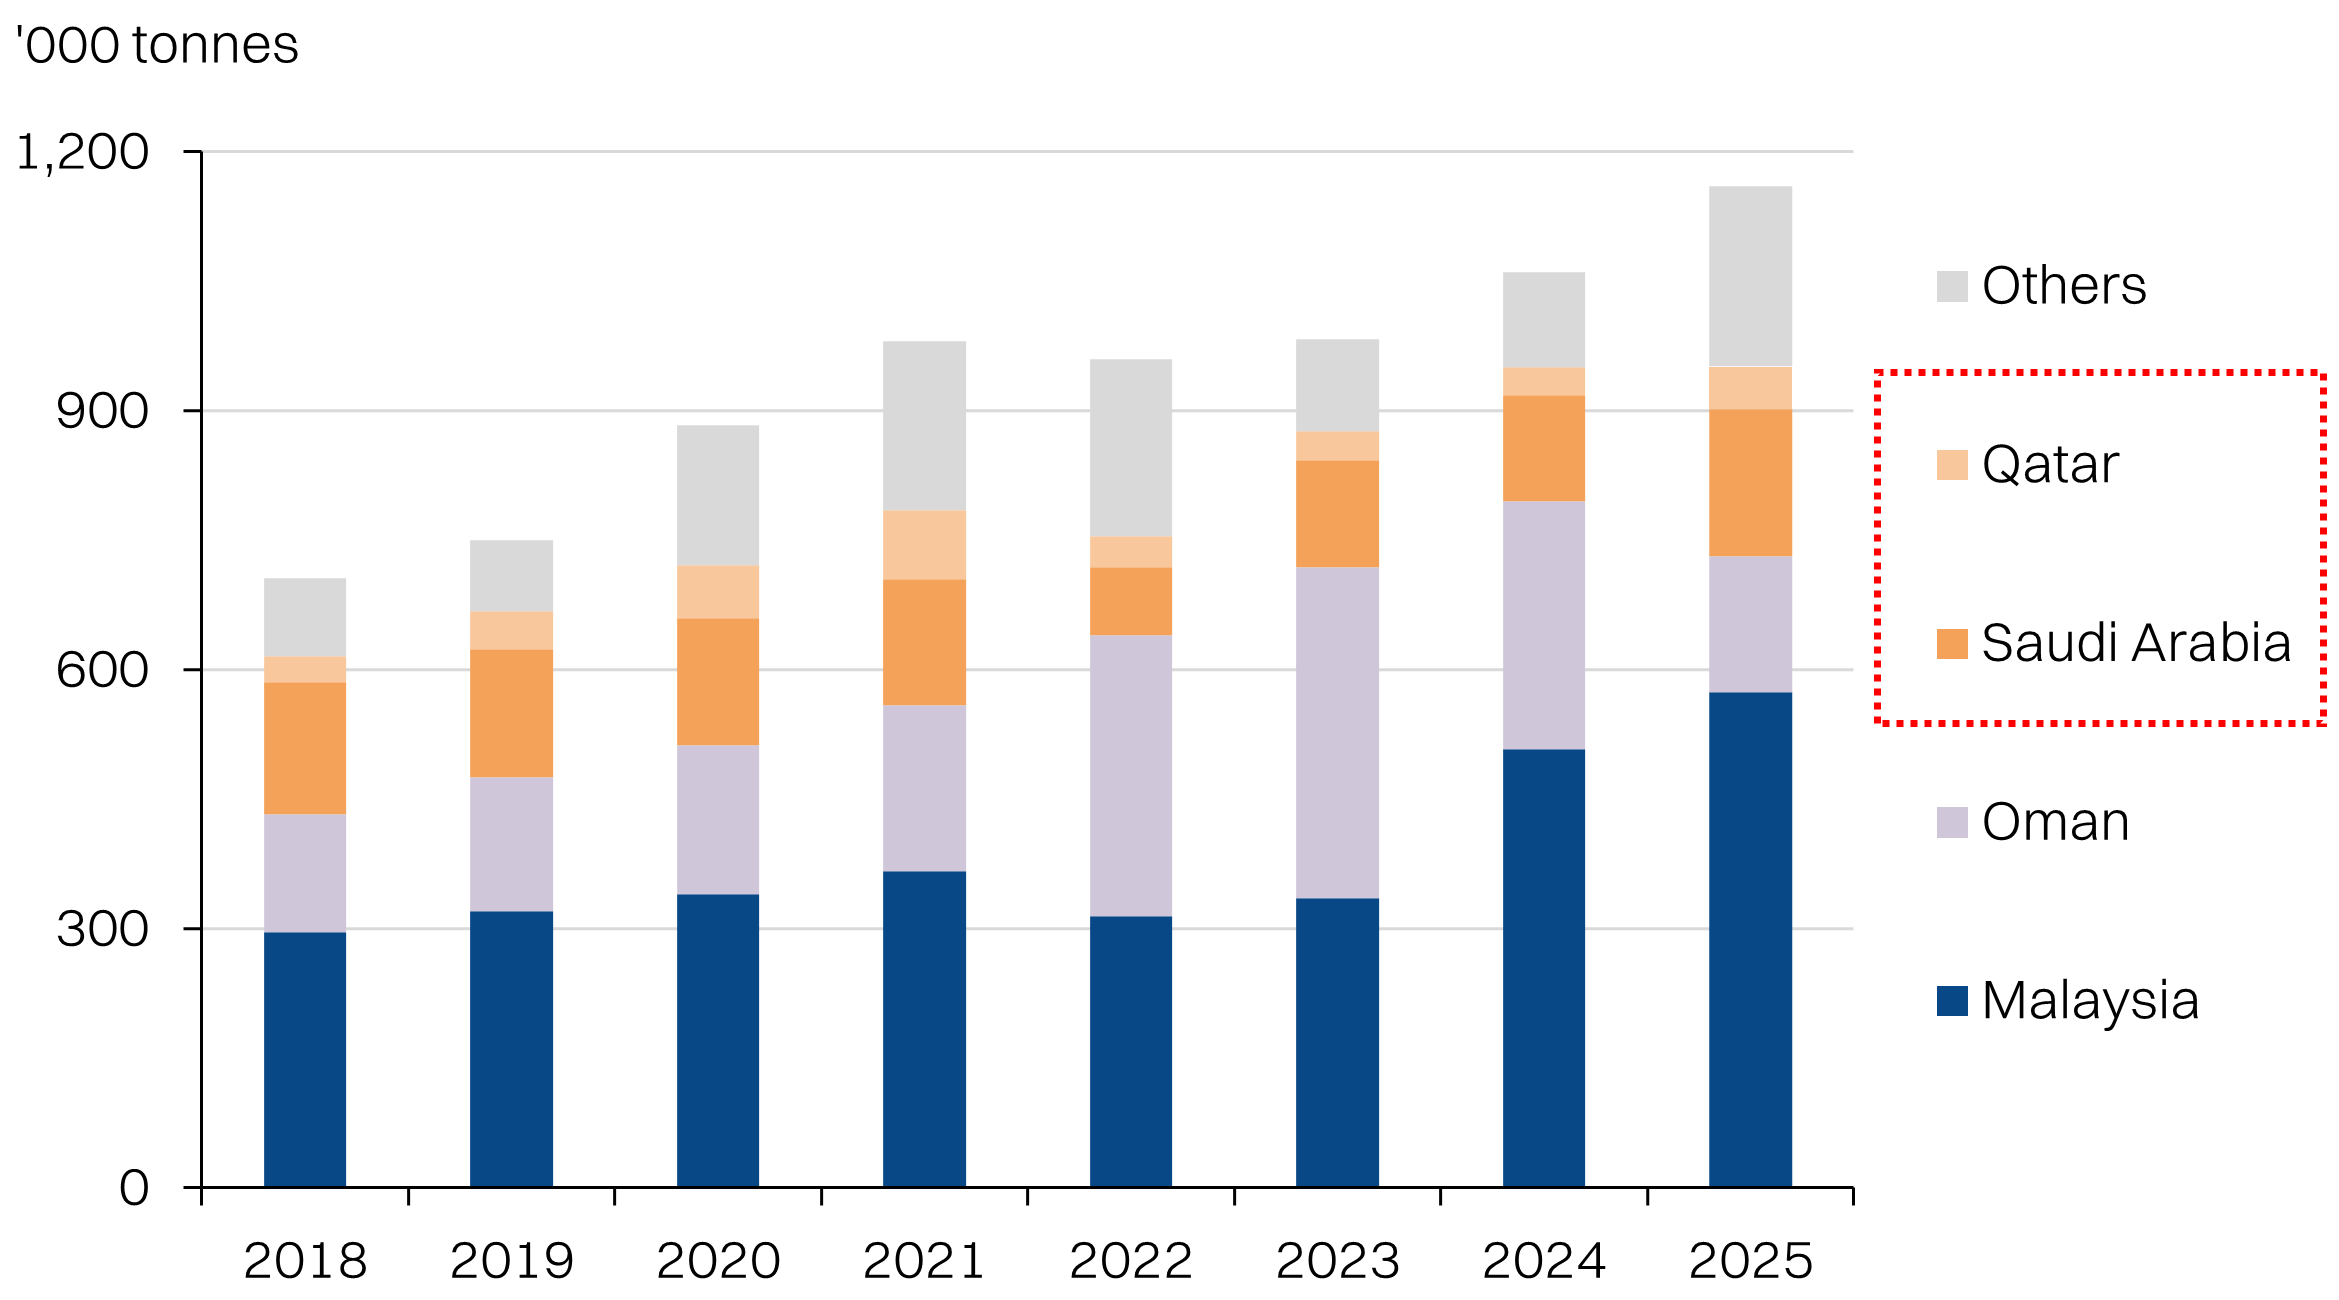
- Indonesia’s second U-turn to implement B50 biodiesel mandates may have taken headlines, but we are wary that methanol could be a bottleneck. Indonesia imports >80% of its methanol, which is a key input to produce biodiesel from crude palm oil. Roughly 19% of import volumes are at risk following the closure of the Strait of Hormuz, with Qatari and Saudi production shuttered.
- At best, we foresee this will hamstring B50 implementation till supplies normalize. At that point, normalizing oil prices could also unwind the economics for the high blending mandate. At worst, it could even eat into the existing B40 mandate and push as much as 3-4Mt of supply back into the export market.
US farmers pivoting to soybean
- Soybean does not require nitrogen fertilisers, making it a lower-risk crop for US farmers this planting season. Furthermore, soybean prices have outperformed corn, supported by the biofuel mandates. US farmers have already indicated a +4% YoY lift in soybean planting this year (at the expense of corn), with room to surprise more on the upside. This will add ~1Mt of soybean oil to balances, on the back of already high global soybean production that has been boosted by a bumper Brazilian crop.
- Impact will be skewed to the harvest season in fall, but should materalize in prices by middle of the year. In fact, US production looks capable of exceeding the increased biofuel mandate demands this year.
Focus on efficient, undervalued planters
- We screened the top 14 plantation names and found JPG has the most compelling valuation relative to its profitability and efficiency. It also helps that it has no Indonesia exposure.
- We’ll also bend our preferences for TSH and overlook its 91% Indonesia exposure for one of the lowest valuations in the sector, despite above average yields - potential re-rating candidate if Indonesia policy risk cools.
- Among the big caps, we’d be splitting hairs, but we prefer IOI on the margin for its lower Indonesia exposure since the other metrics are fairly similar compared with SDG and KLK.
What could dampen palm oil’s windfall year?
The plantations sector has been one of the top beneficiaries from the war in Iran, up +11%. This has been driven by a surge in crude oil prices that in turn lifted CPO to as high as RM4,745 (+19%) on anticipation of increase biodiesel demand as a prime driver. Even with the shaky 2-week ceasefire announced, CPO prices remain healthy, north of RM4,500/MT.
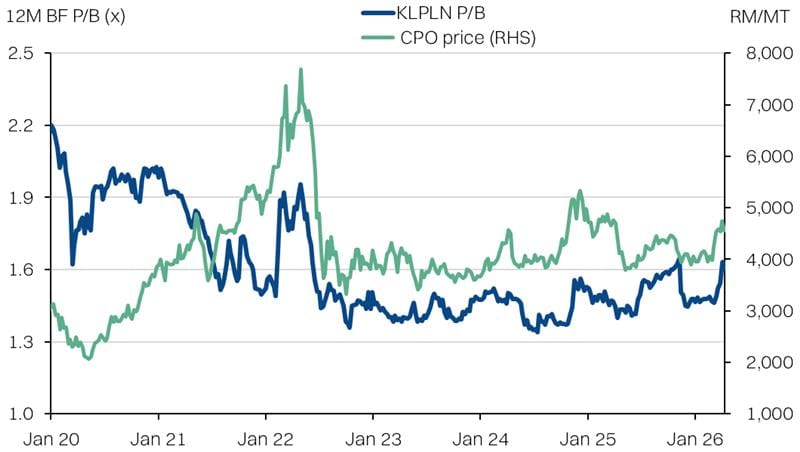
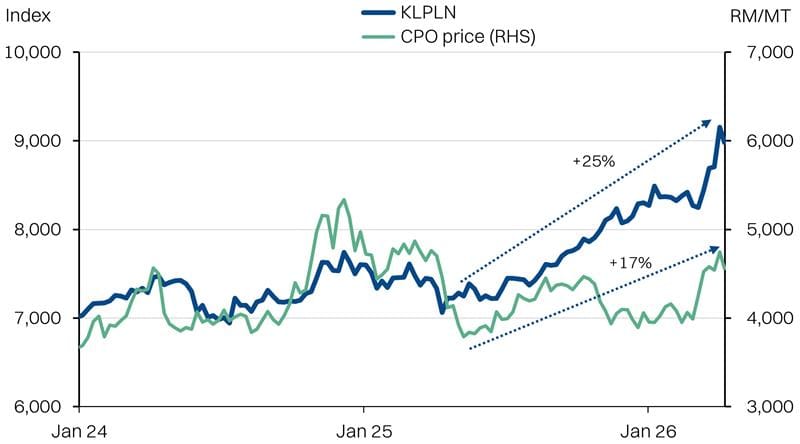
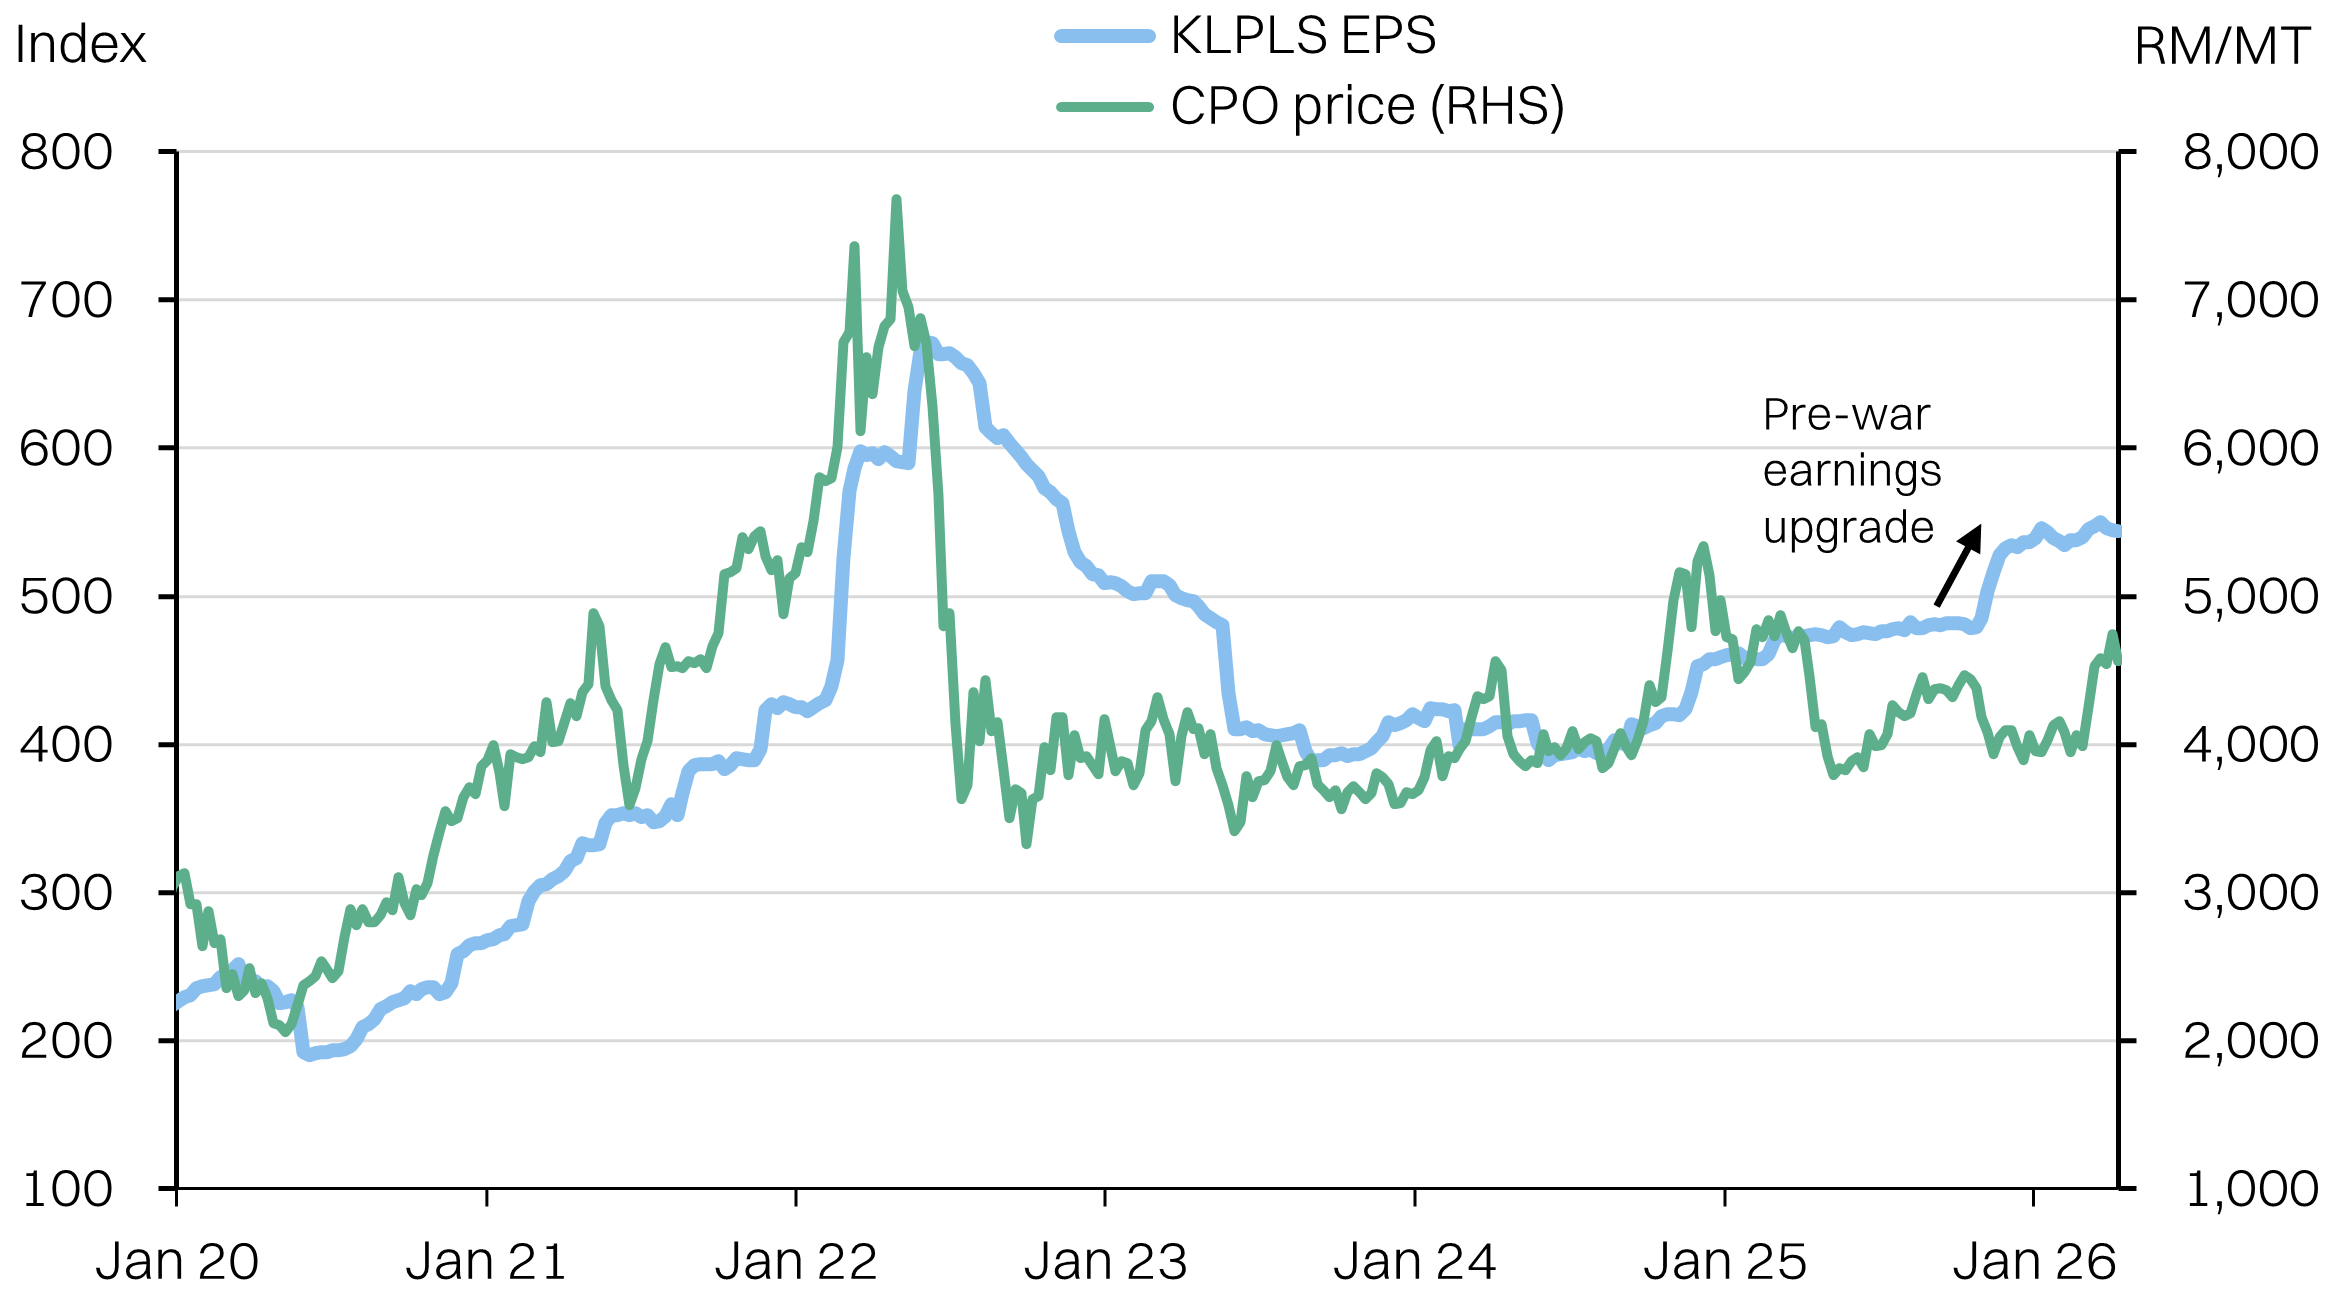
Yet, it has been plantation stocks that have been the bigger beneficiary. Against a +17% surge in CPO prices from the trough in May 2025, the KL Plantations index is up +25%.
To be clear, we think the sector is still due for a windfall year on the elevated CPO prices. However, we cover a few potential speedbumps that could lower the ceiling for the sector, arising from the Iran war: corn-to-soybean substitution planting and methanol shortages in Indonesia.
The KL Plantation Index has outperformed CPO over the past 12 months
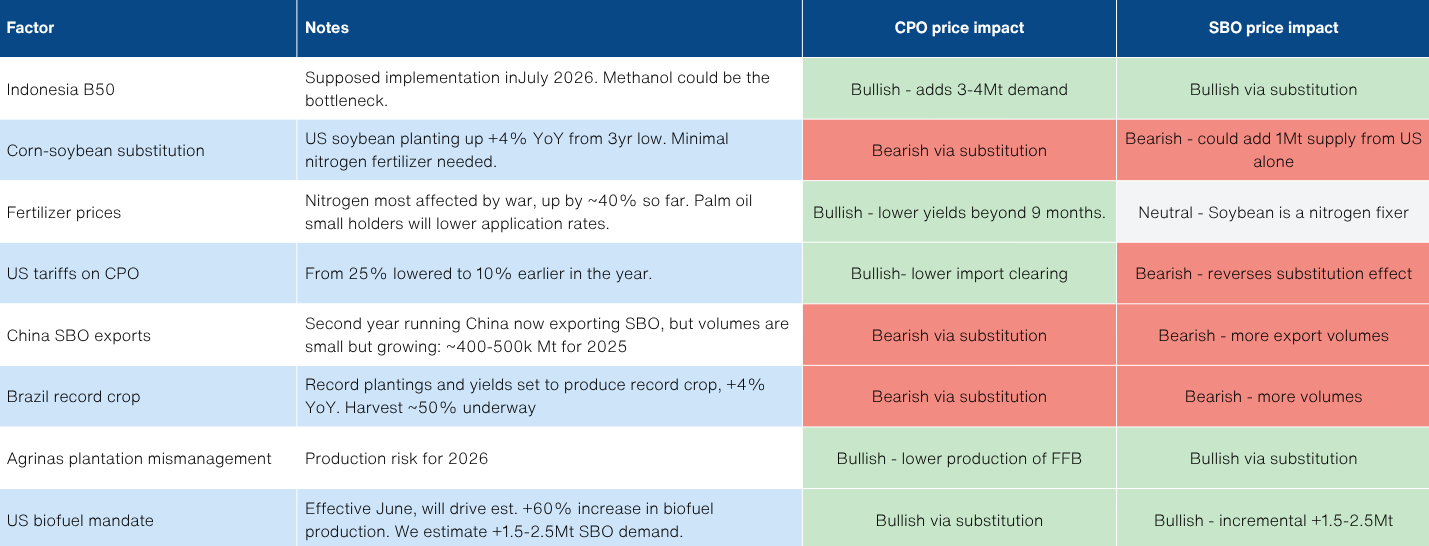
Risk matrix for CPO/SBO - we focus on the first two in this report
Indonesia’s biodiesel bottleneck - Middle Eastern Methanol
At face value, Indonesia should expand its biodiesel blend mandates and leverage domestic crude palm oil (CPO) to blunt the oil price shock to the economy. We expect Brent to stay above US$70-80 this year, even after the ceasefire. On paper, this would tighten CPO exports and drive CPO prices up. This would be especially beneficial for Malaysian planters.
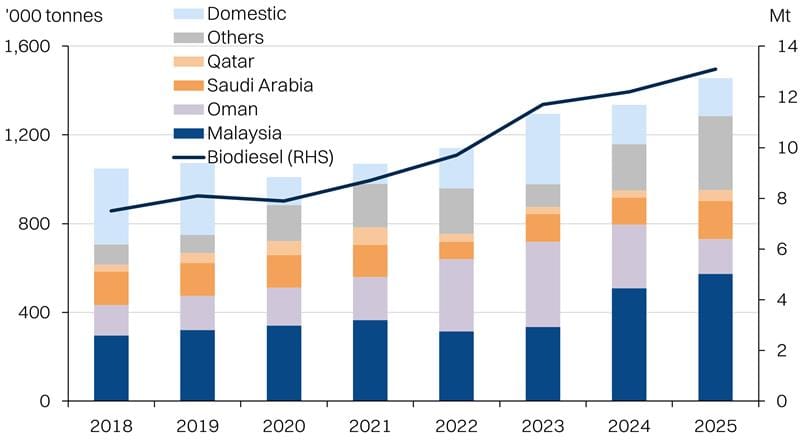
However, methanol is a key input in the biodiesel production process - transesterification. Roughly 90-100kg of methanol is needed per ton of biodiesel. Critically, Indonesia relies on imports for more than 80% of its methanol requirements, of which at least 19% of supplies have been disrupted by the closure of the Strait of Hormuz. Additionally, another 16.5% comes from Oman, which is not yet disrupted but at risk from missile/drone attacks.
At best, this will severely limit Indonesia’s ability to ramp up biodiesel production. At worst, curtailment of biodiesel production of 15-20% would add 1.9 to 2.5Mt of CPO supply back into the market - roughly 38-50% the relative quantity vs Malaysia and Indonesia’s combined inventories.
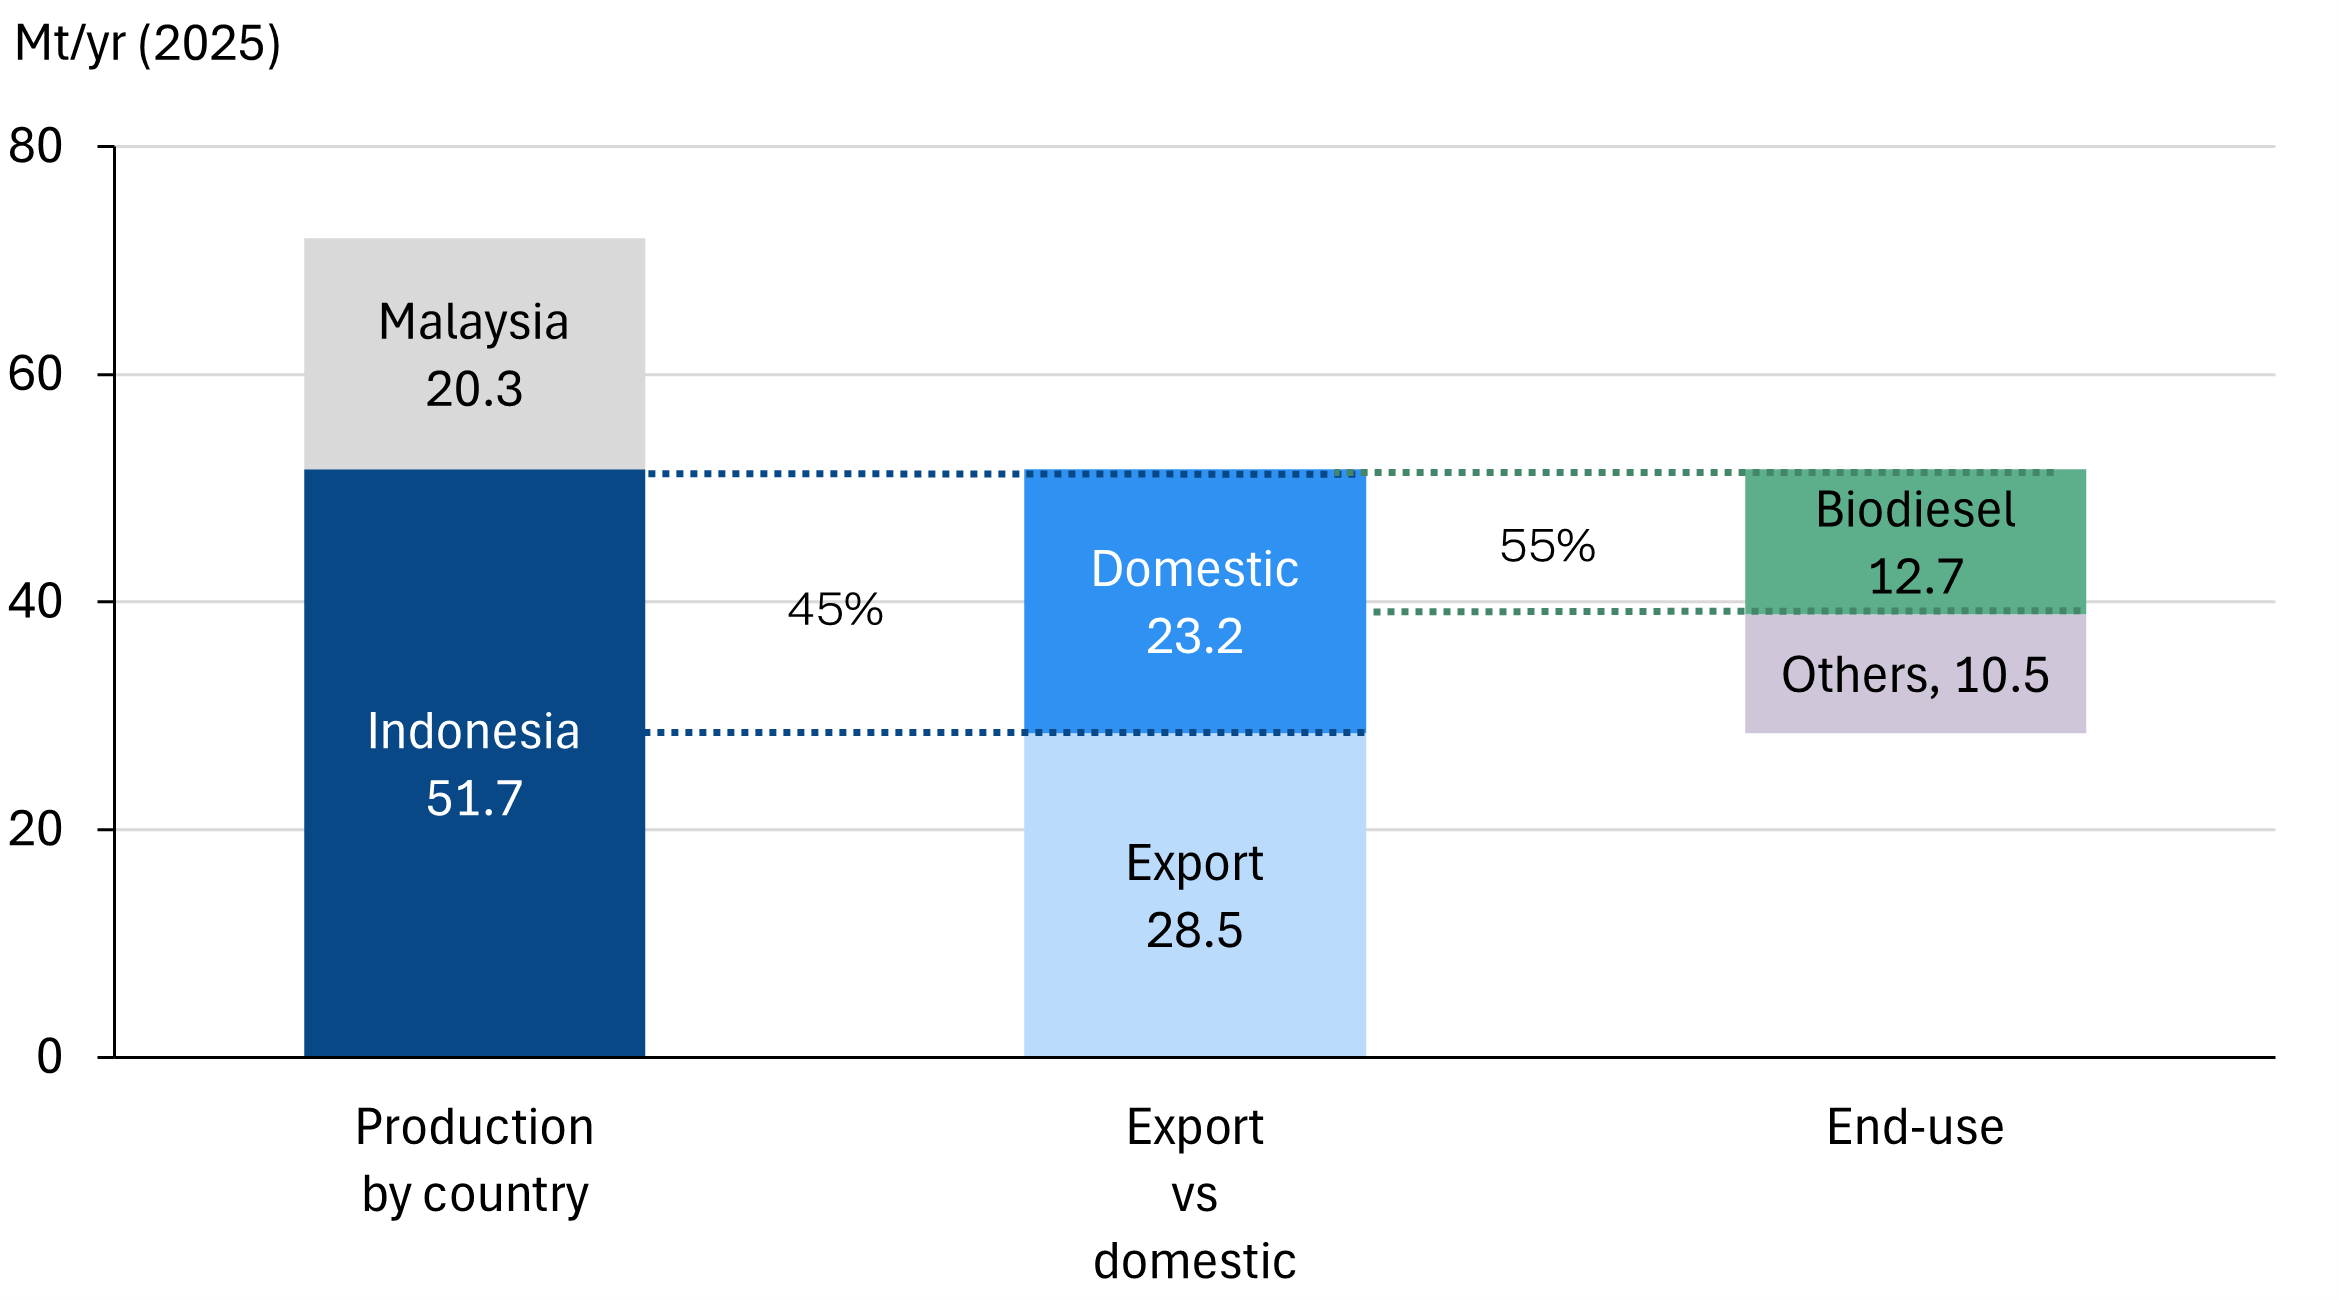
Indonesia’s biodiesel accounts for 17-18% of total CPO production
Indonesia imports most of its methanol requirement
Supply response could be limited in the ST
Even with the ceasefire, both Qatar’s QAFAC and Saudi Arabia’s Saudi Methanol Company (Ar-Razi) have shuttered production and will take 2-6 weeks to restart. Only pre-war stockpiles could come into the market for now, if the Strait is opened. But with the unpredictability of the ceasefire, Middle Eastern petrochemical plants might have to wait for better visibility on the US-Iran war before committing to a restart.
Onshore, Indonesia has limited onshore methanol production via PT Kaltim Methanol Industri, with a 660kMT capacity plant in Bontang, East Kalimantan. However, due to limitations in gas supply (feedstock), the plant has been operating at <50% capacity. We do not anticipate that this limitation can be addressed in the ST to boost production. Indonesia does export a small volume of methanol - about 50-60k MT/yr. This could help offset about 30% of the volumes lost from Saudi Arabia and Qatar, assuming all exports are halted.
Lastly, methanol exported via the Salalah Port in southern Oman could be disrupted. The port has already been struck once on 28 March, albeit with minor damage.
Methanol exporting ports: Omani is at risk of disruption
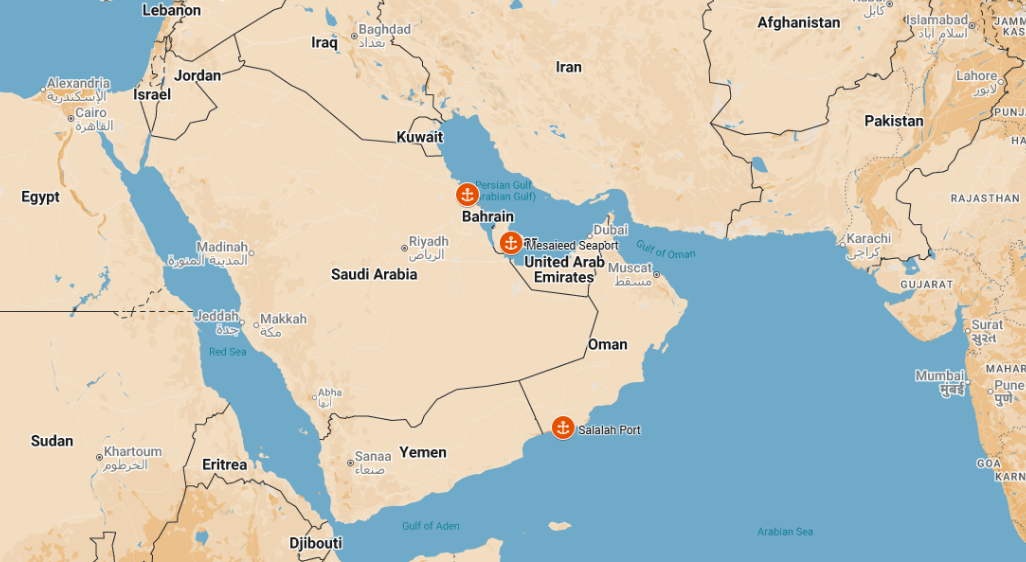
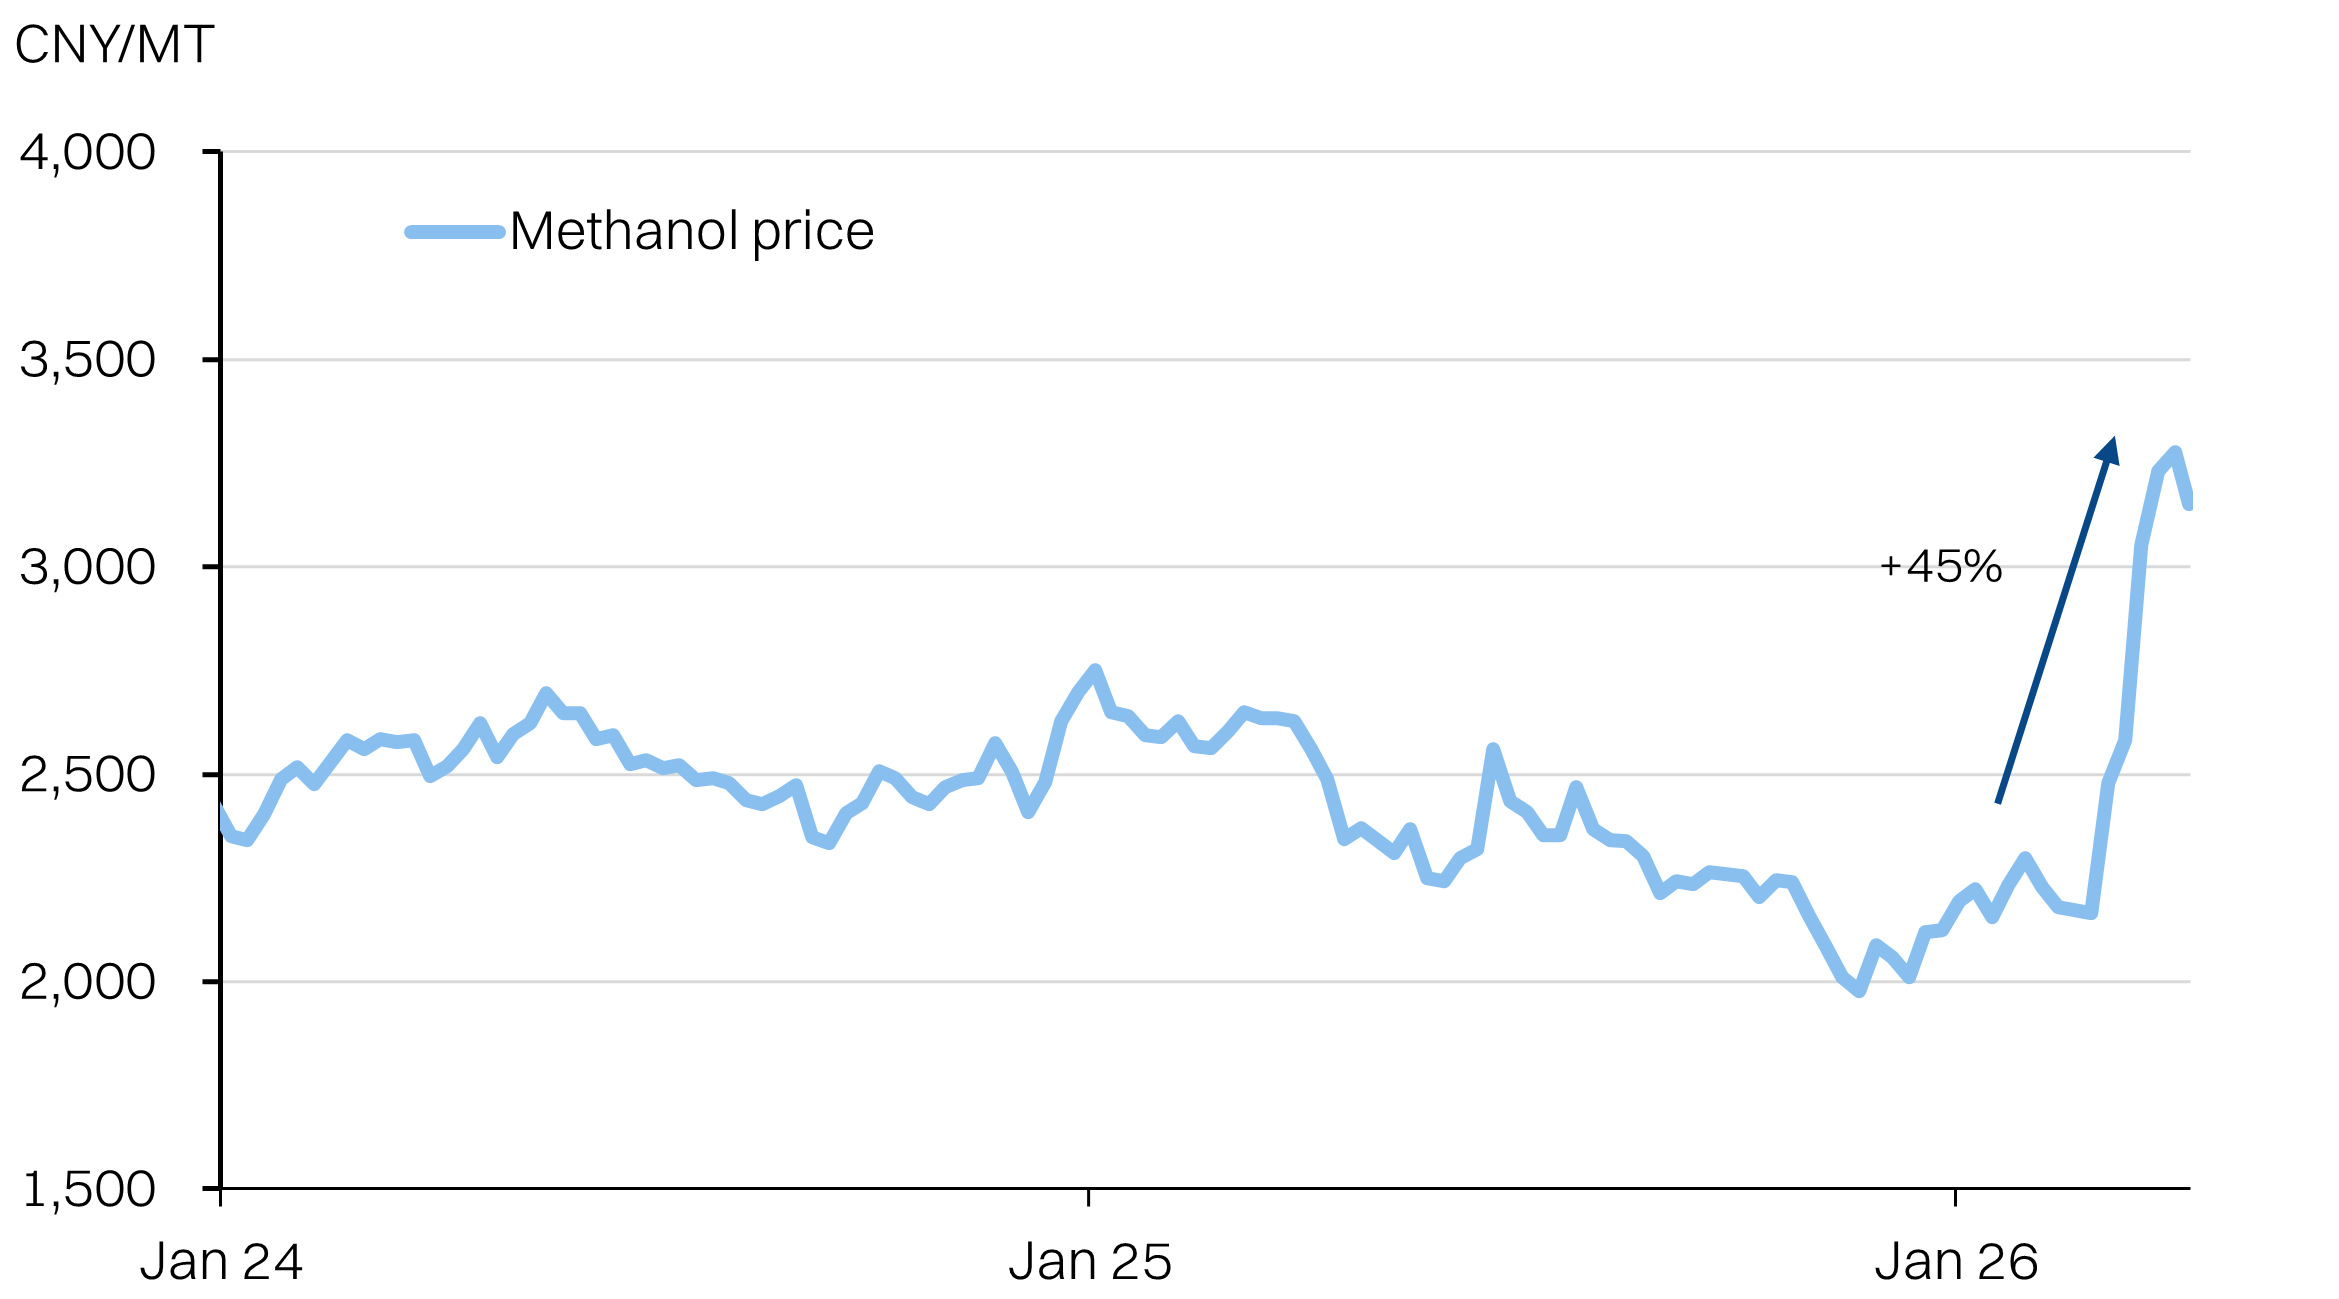
Methanol prices - an indication of the shortages
The B50 flip-flop
Indonesia in 2024 implemented a 40% biodiesel blending mandate (B40) but initially delayed the rollout of the B50 mandate in January this year. The government indicated that it could be revisited by end-26 for a 2027 implementation. Since the spike in oil prices, the government has announced that it will now implement B50 by July 2026. With the ceasefire however, B50 could be postponed again.
A key policy objective of the biodiesel mandate is to lower reliance on oil imports and manage diesel prices onshore. It could also cushion the pressure on the trade deficit. Indonesia’s biodiesel program is funded by the export levy on palm oil under the Palm Oil Plantation Fund Management Agency (BPDPKS), which compensates biodiesel producers for the difference between the biodiesel reference price and the domestic diesel benchmark. In order to fund B40, the export levy was raised from 7.5% to 10% in 2025. A further increase to 12.5% was announced in March 2026. All else equal, this is a relative headwind for Indonesia-based planters.
In terms of capacity, Indonesia has ~358kbpd capacity of biodiesel production capacity but is currently operating at around 55% capacity since the implementation of B40. We estimate the CPO requirement to support B50 will increase from the current ~12.7Mt in 2025 (B40) to around ~16 Mt. If executed as planned, it would have to be driven by reduced CPO exports (-11%), tightening global CPO supplies. In turn, this would be positive for CPO prices.
Timing will be key. Absence of newsflow on biodiesel supply issues suggests that at present, the physical methanol disruption may not yet have caught up with production, yet. Indonesia likely has some inventory of methanol as the absolute volume is relatively small to the primary biodiesel feedstock. Reopening of the Strait could also allow some stockpiles to be delivered.
The B50 implementation on 1 July will be key to watch, as it would put increased stress on methanol requirements. Of course, the situation in Iran remains fluid developments on the ceasefire will determine how this plays out. As it stands, we anticipate B50 implementation will be delayed again.
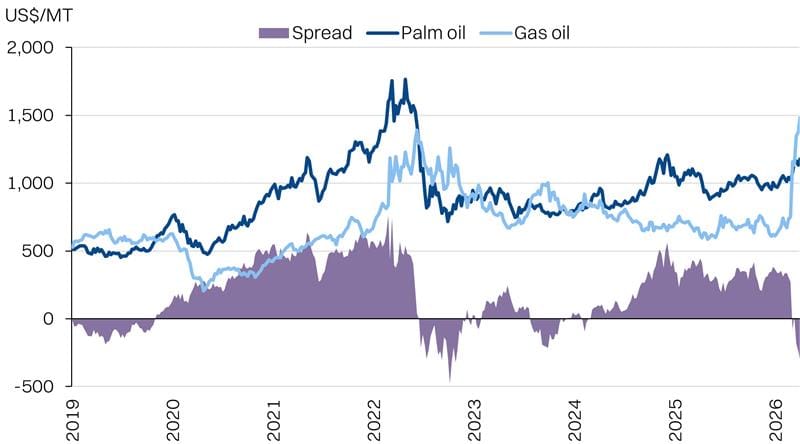
POGO spreads
Nitrogen fertilizer supplies from the Middle East are choked
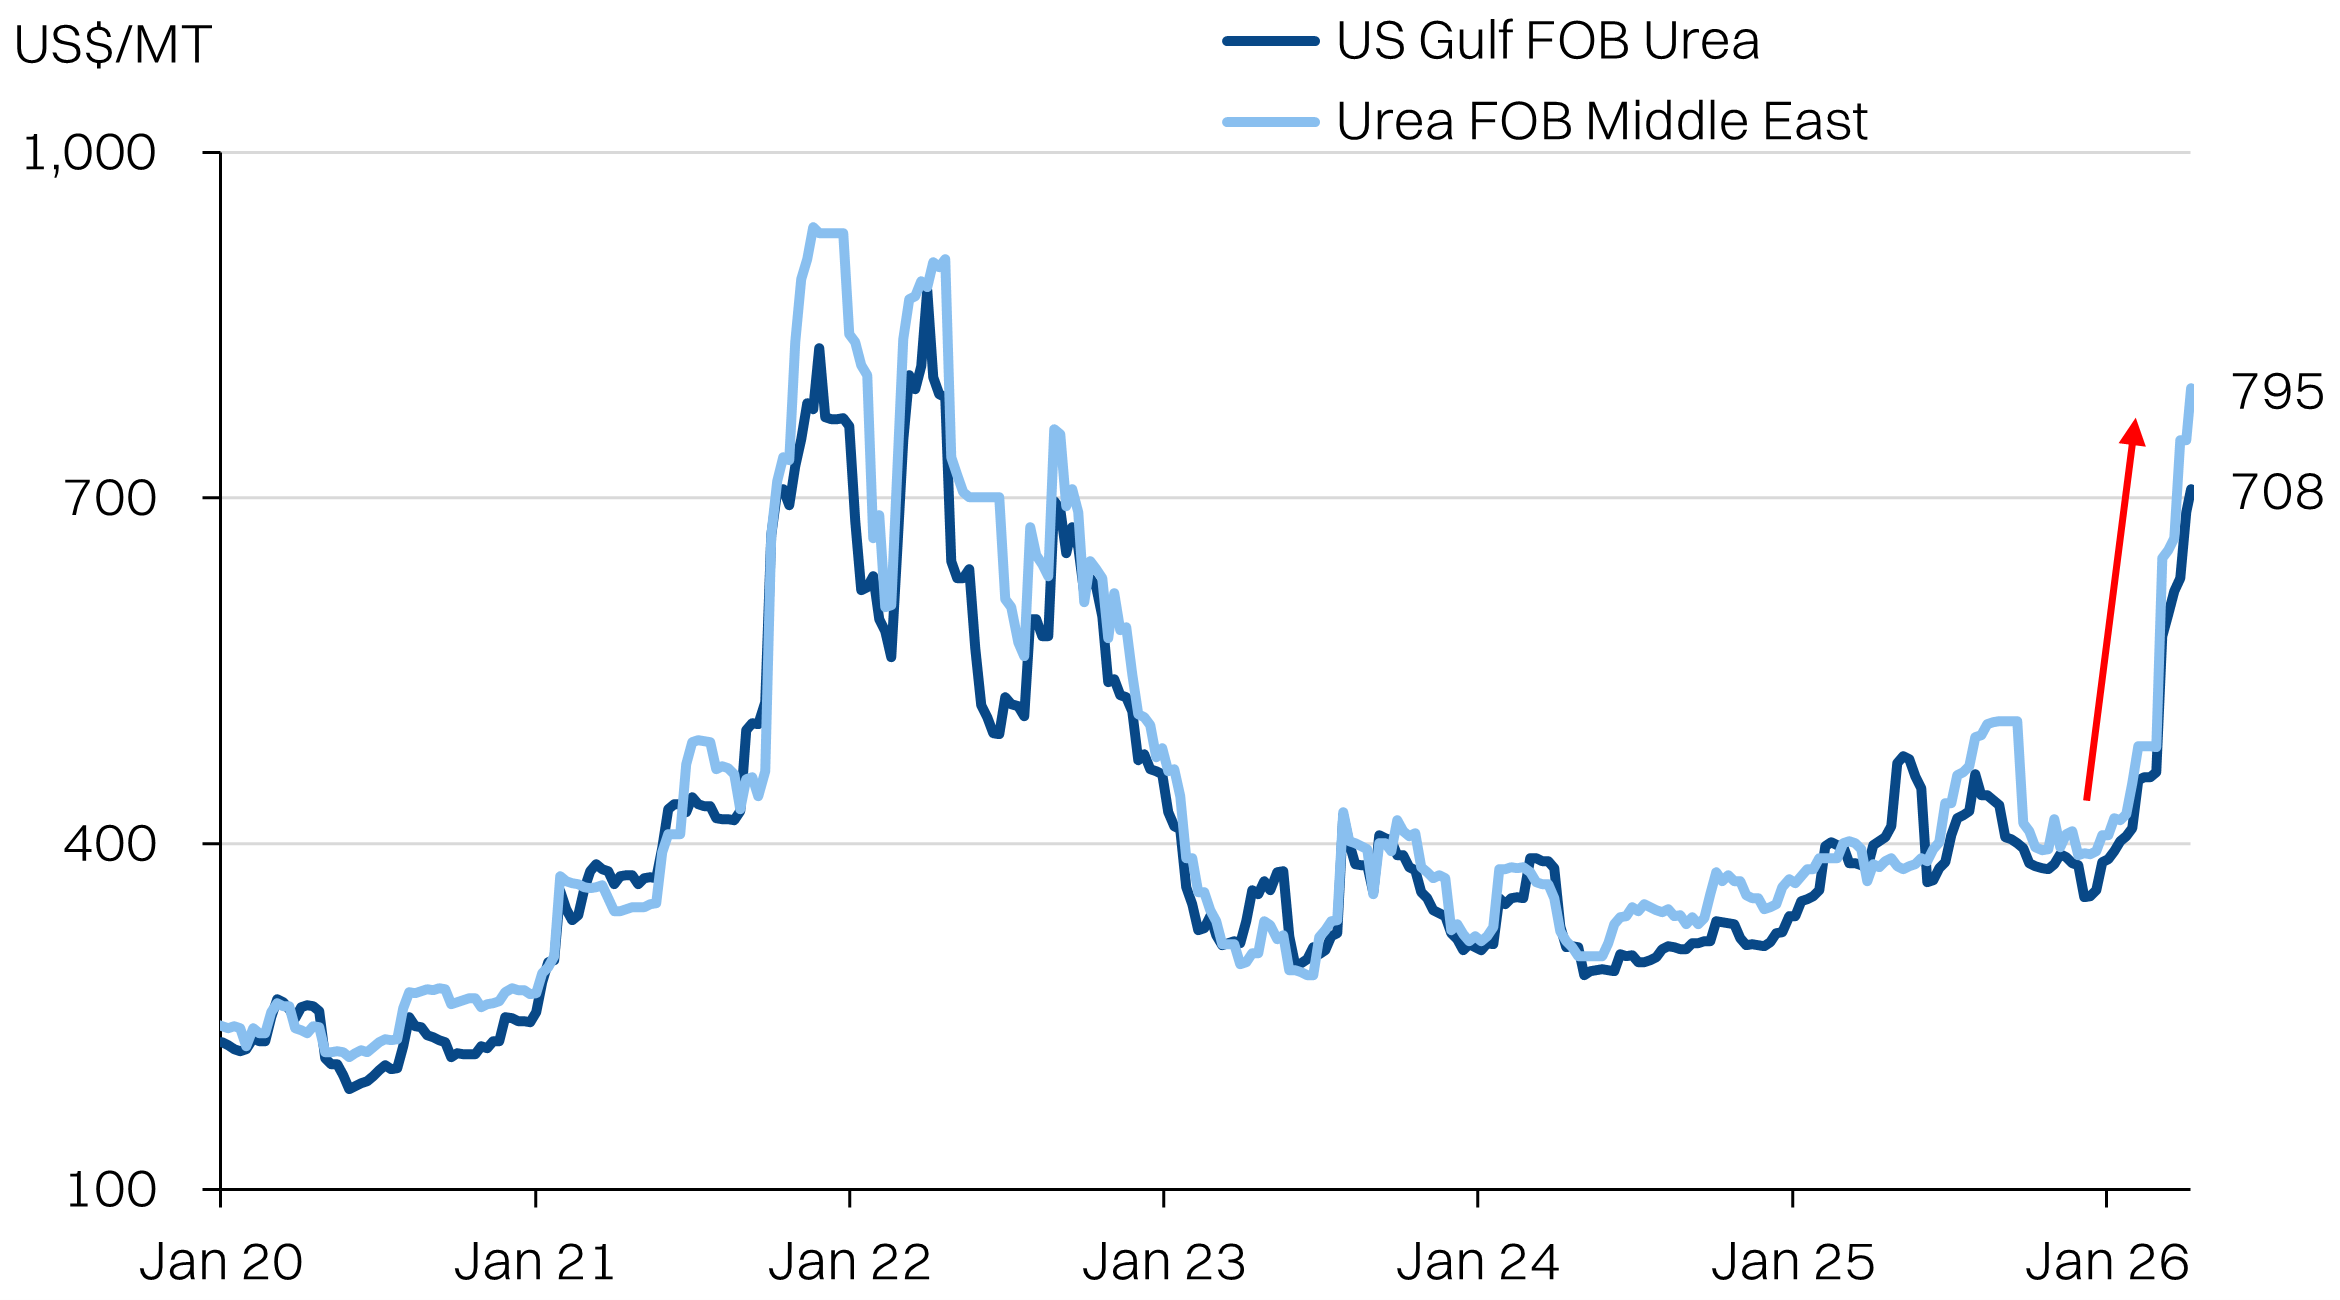
Urea is the primary synthetic nitrogen fertiliser in use and prices are up +65% since the war began. It is simply because one-third of the global urea and urea precursors originate from the Middle East. Urea is made from ammonia which is in turn made from natural gas via the Haber-Bosch process. This means the global LNG shortages will also drive-up urea prices. Iran is the fourth-largest exporter of urea after Russia, Egypt and Saudi Arabia.
China and US are also major ammonia producers, with the former reliant on coal as the feedstock instead of natural gas. While urea is applied by palm oil planters, it is the potential indirect effects that could have a bearing on CPO prices.
The crucial spring planting and fertiliser application window is occurring right now, and farmers will not have the luxury of waiting on fertiliser prices to normalize later in the year, assuming the current ceasefire holds. In turn, planting decisions for corn and soybeans are being locked in right now that determine fall harvests.
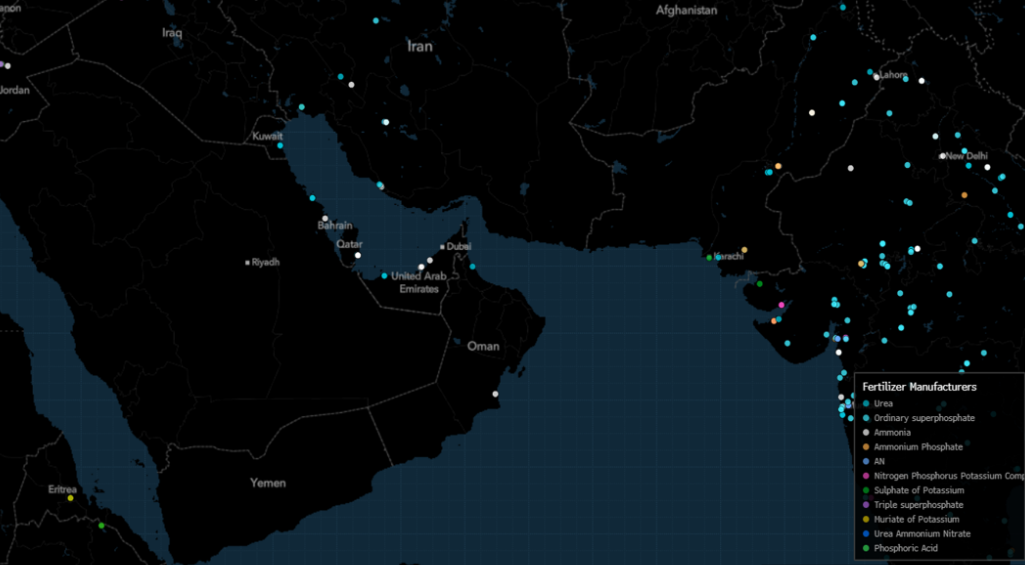
One-third of nitrogen fertilizers pass through the Strait of Hormuz
Urea prices have surged +65%
Nitrogen fertilizer prices are driving US farmers to switch corn for soy
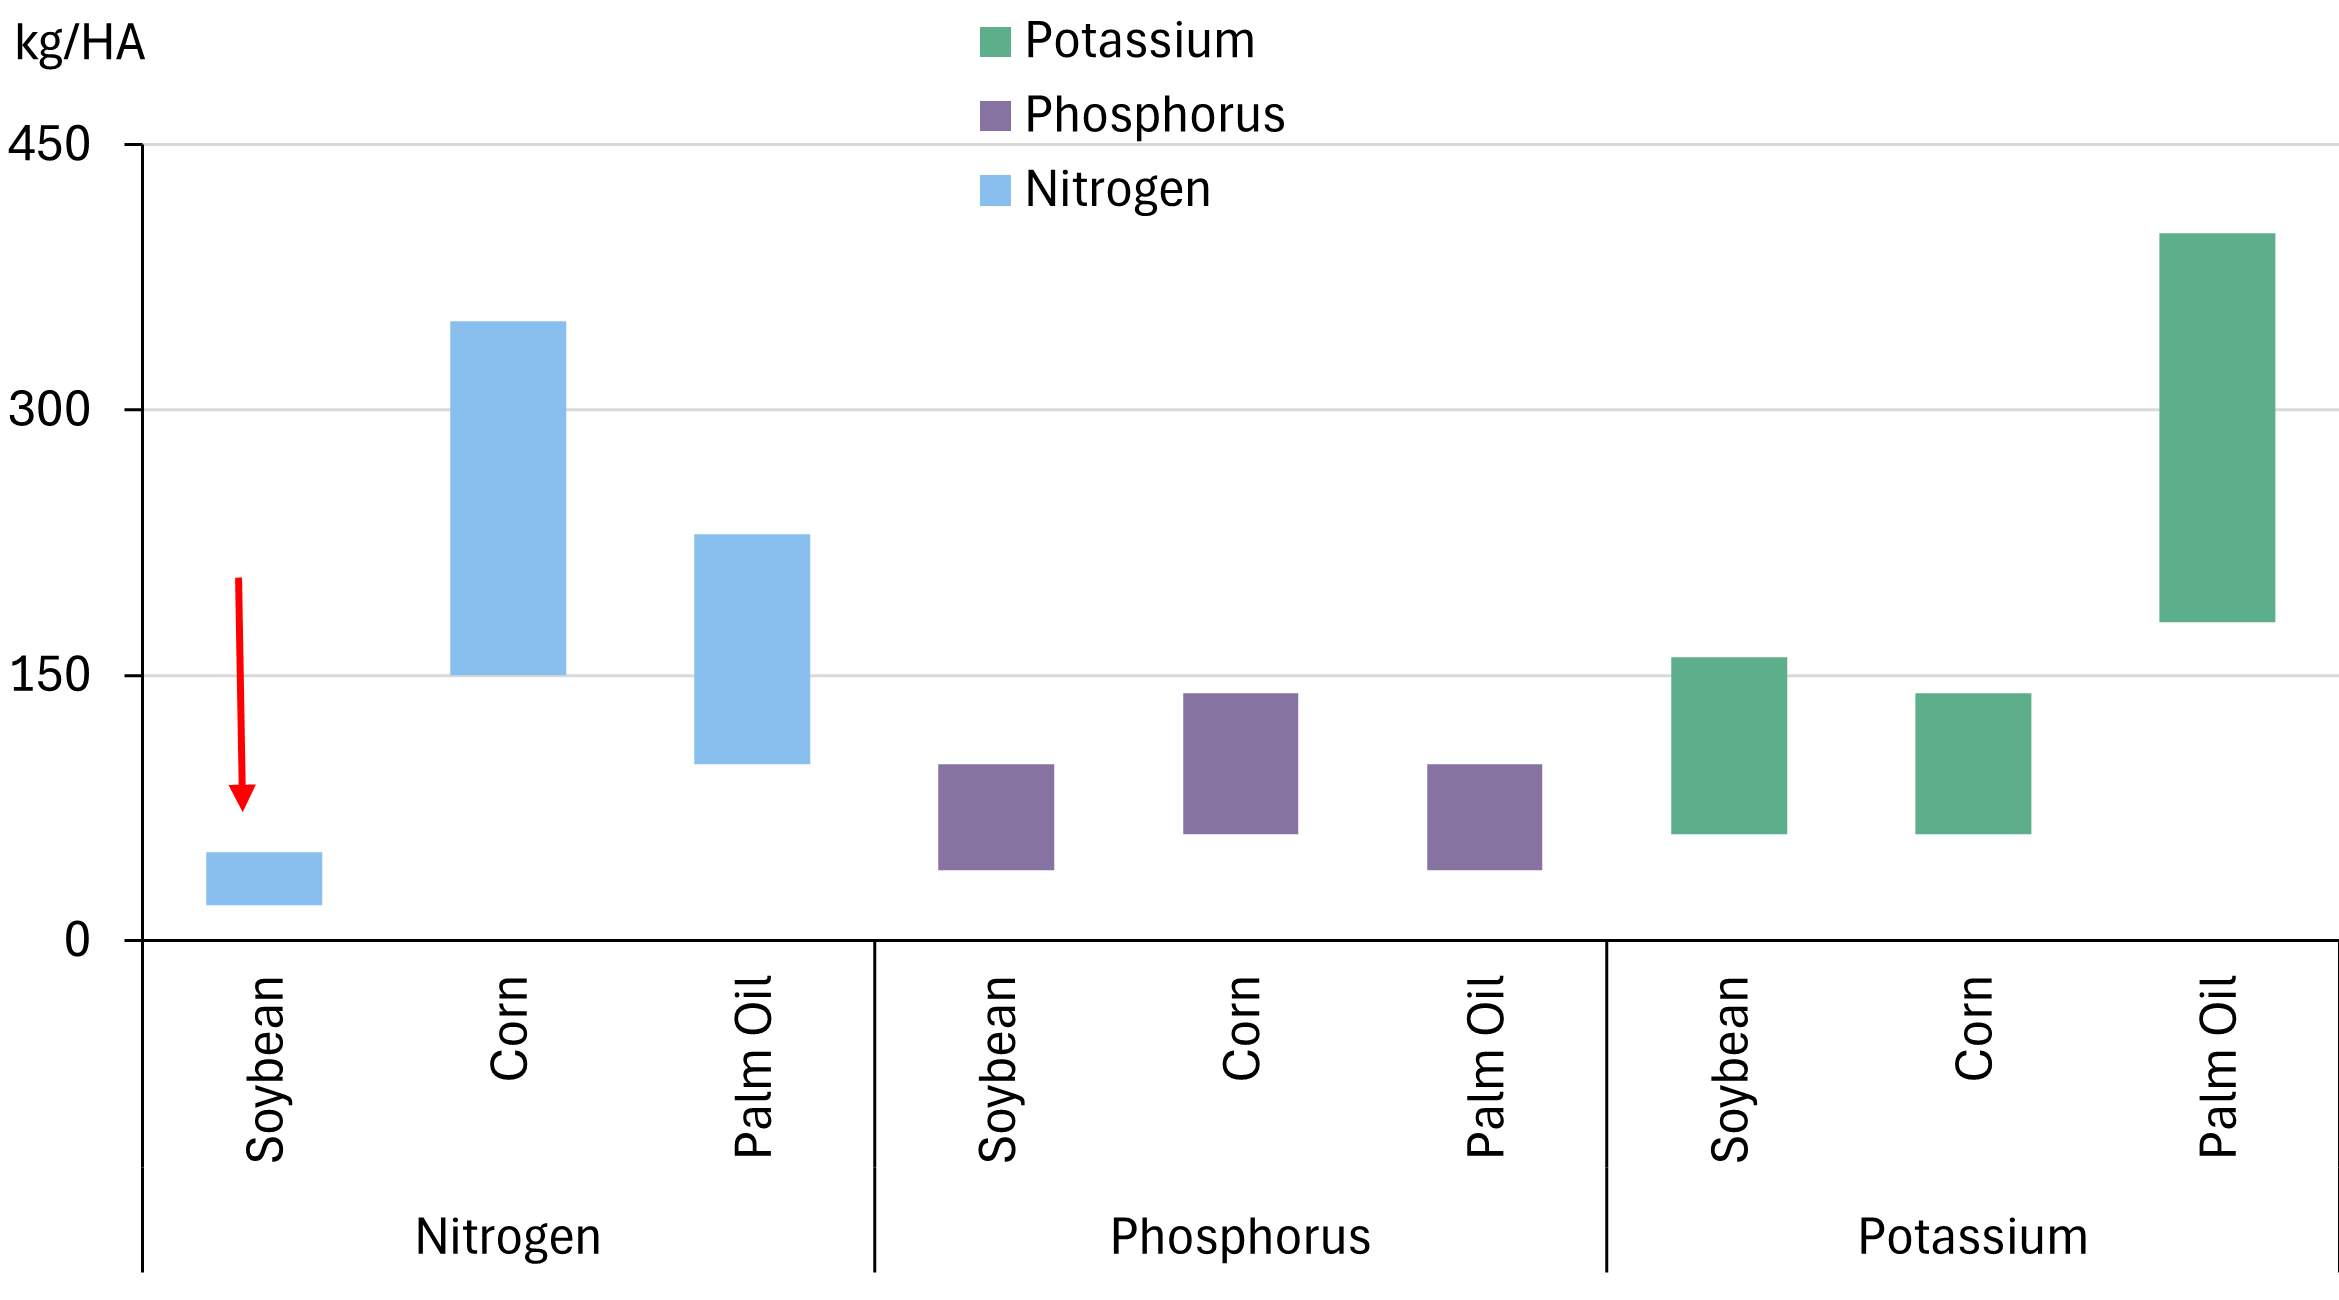
Readers might recall a lesson from high school biology - soybean plants have a symbiotic relationship with rhizobia root bacteria that helps fix atmospheric nitrogen into the soil. This substantially reduces the nitrogen fertiliser requirement of soybeans, which is proving to be a unique strength for the crop since urea prices have surged.
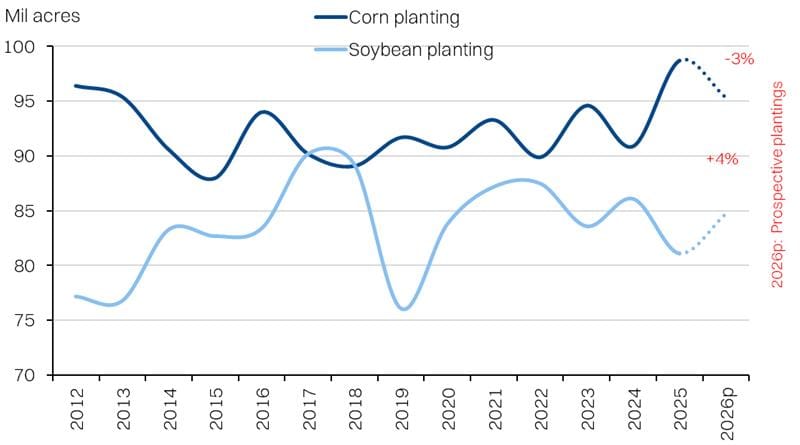
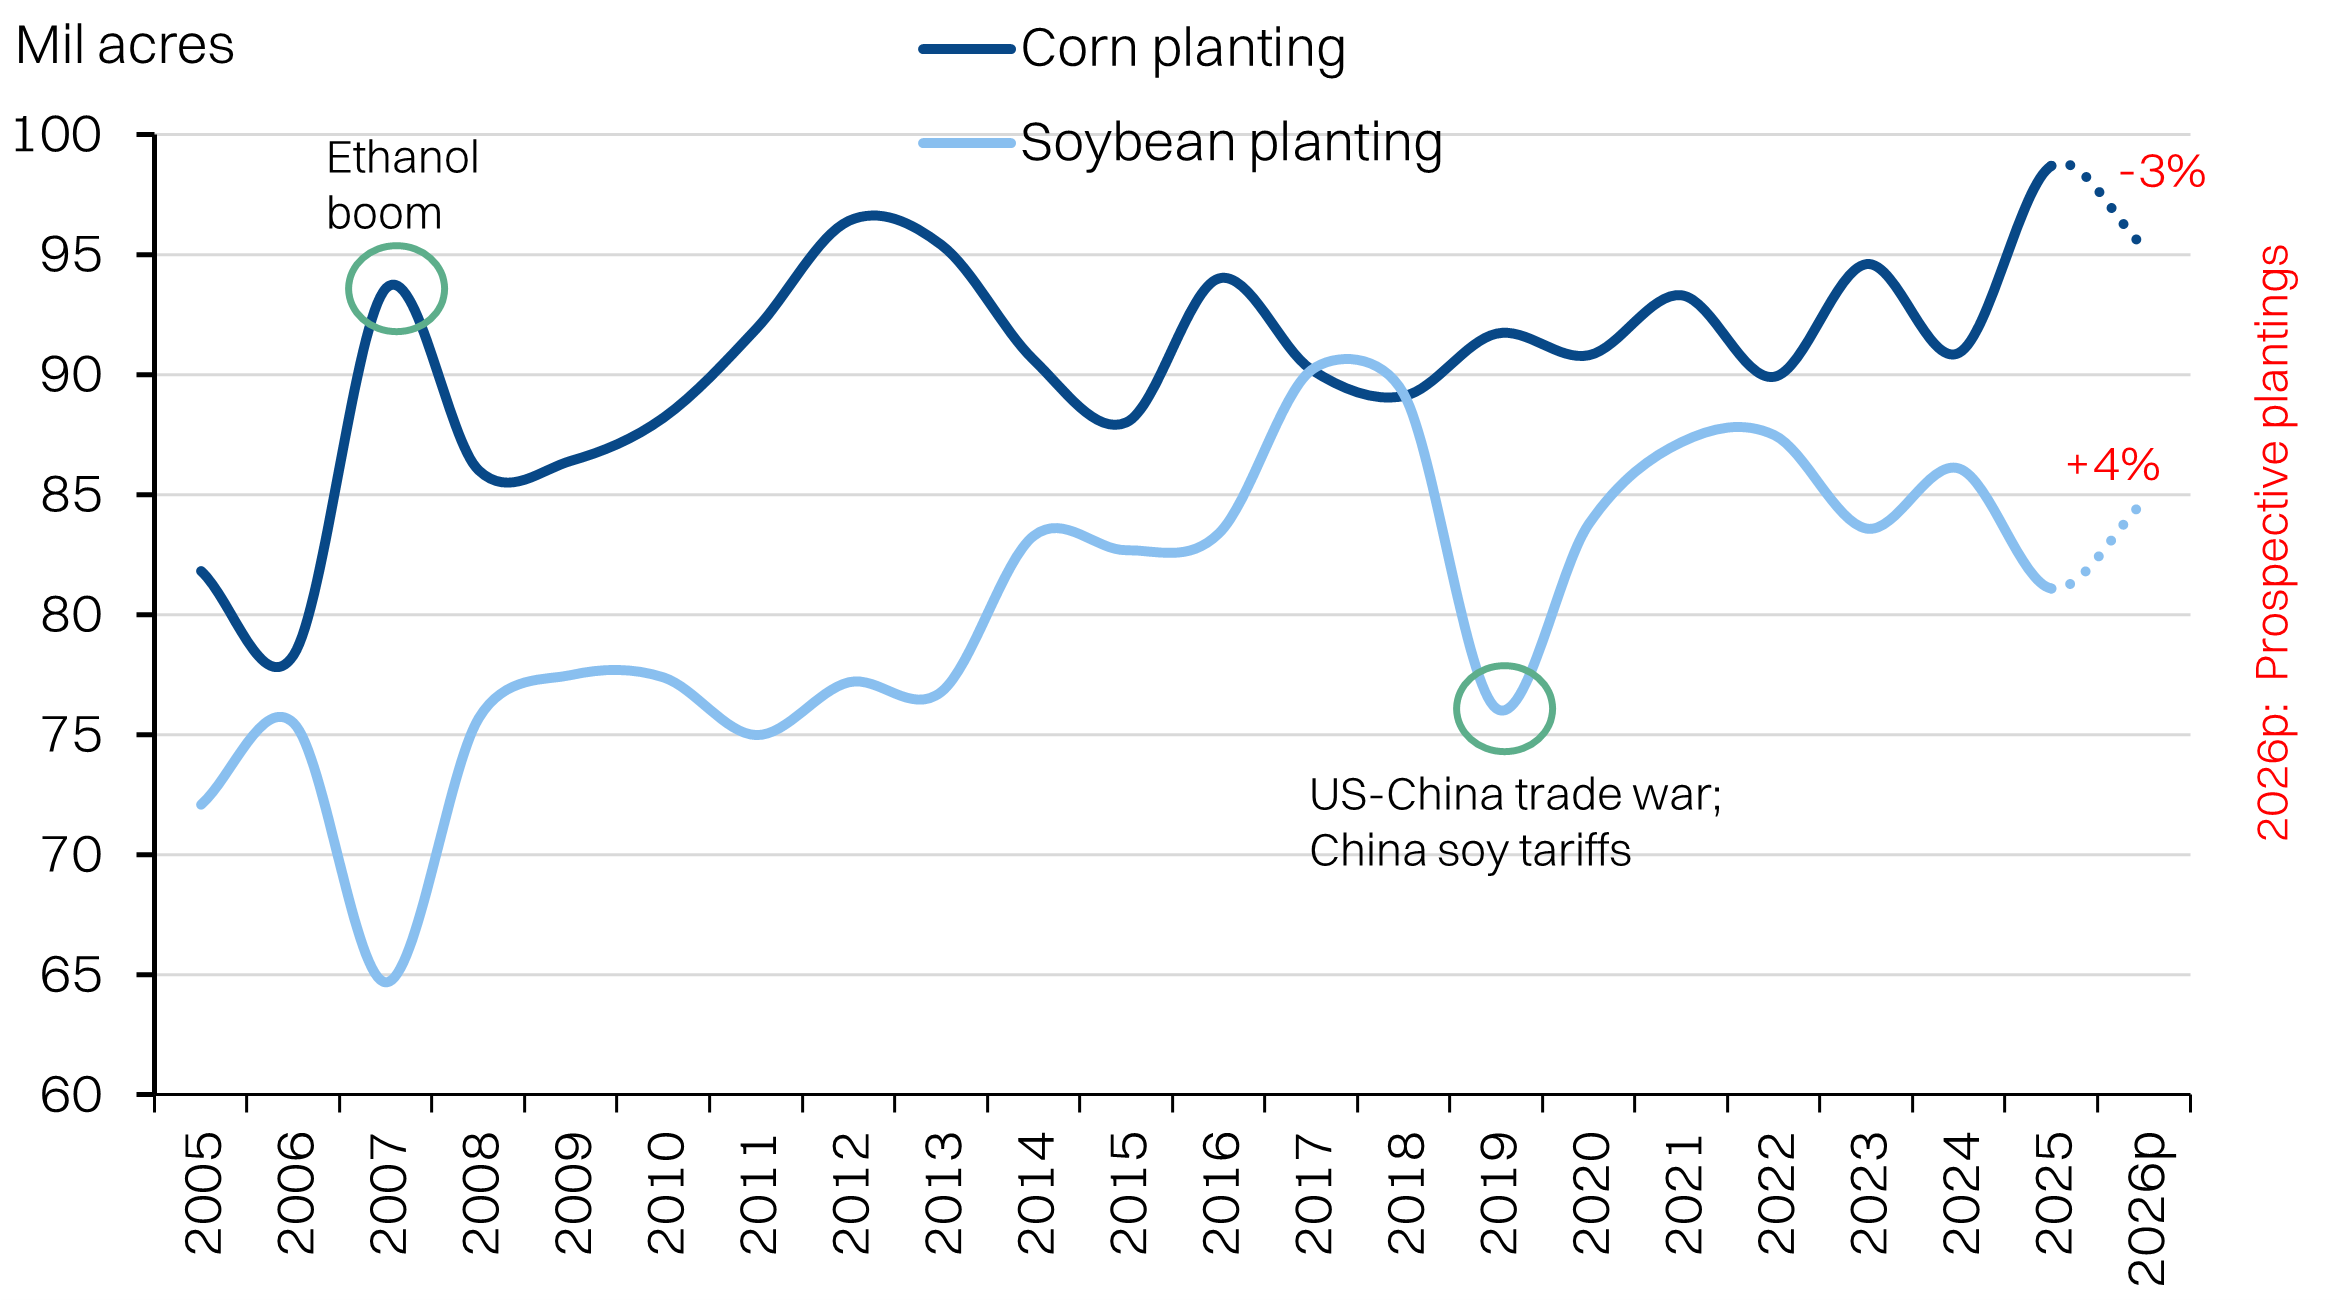
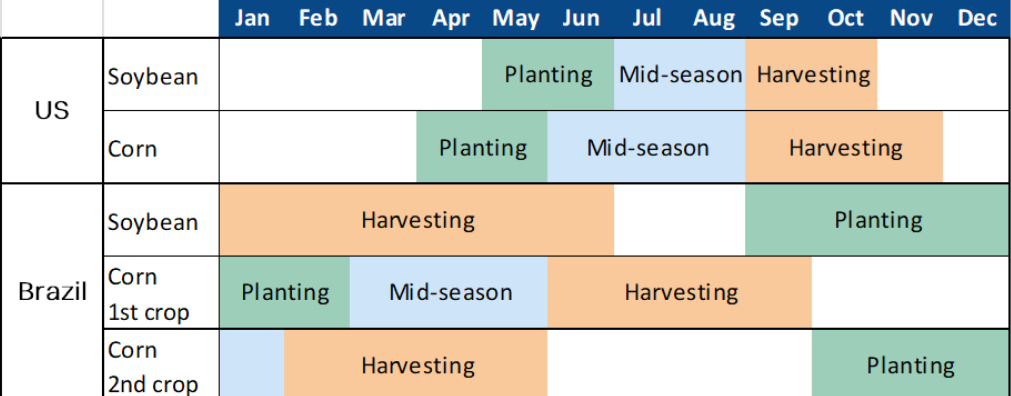
Conversely, corn is one of the more nitrogen hungry crops - requiring as much as 10x the application compared with soy. Critically, the spring planting cycle for soybean and corn overlaps and compete for the same acreage. The USDA’s planting report is already showing planned reduction in corn acreage of -3% YoY in favor of soy (+4% YoY). The supply bump for soy, however, will not show up harvest season in the fall.
In turn, the incremental supply of soybean oil could begin to place pressure on CPO prices into the second half of the year, pending crop yields. Note, that the figures presented by the USDA are simply the prospective plantings and actual plantings for soy could be higher, given how quickly fertiliser prices have been rising.
Soybean plantings are on the rise after a 3-year low in 2025
Soybeans have low nitrogen fertilizer requirements
Fertilizer vs crop price dilemma
Farmers in the US will be facing a dilemma. Currently, corn and soybean prices are elevated due to the Iranian war. So too are fertiliser prices, just as planting season has begun. However, it is less clear if crop prices will remain elevated closer to harvest time in fall.
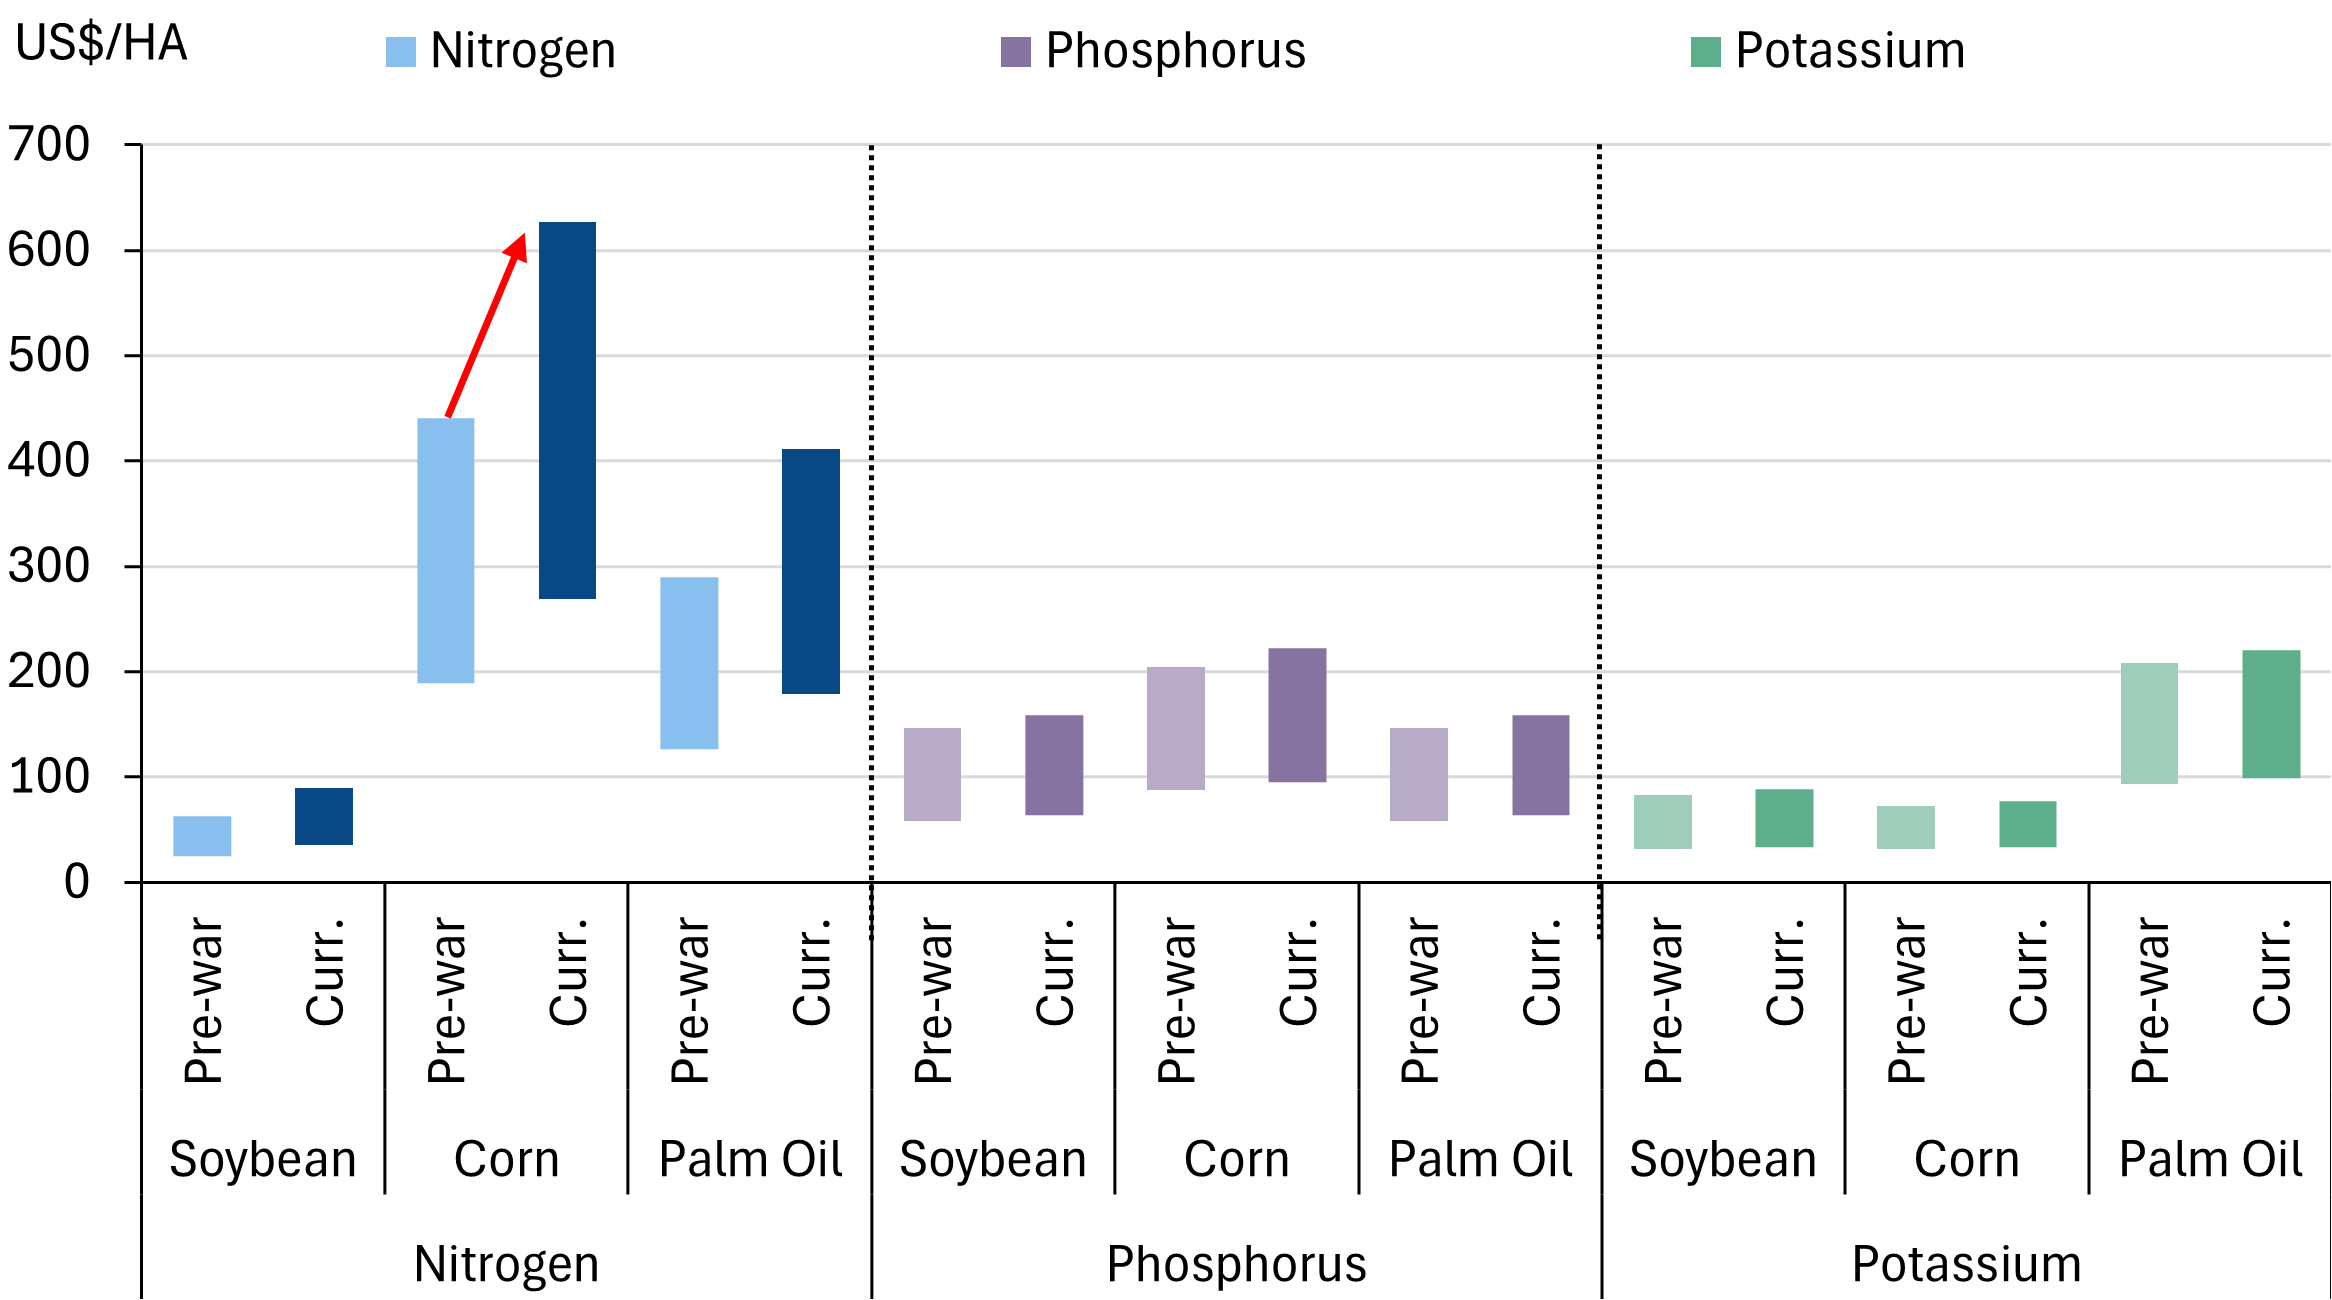
Soybean barely requires any synthetic fertiliser. However, corn requires a substantial application of anhydrous ammonia pre-planting; March-April. The next fertiliser application window in May-June, will require urea.
The ~40-50% spike in nitrogen fertiliser prices, puts the most financial pressure on corn. Also note that 35-40% of corn production in the US is used to produce ethanol that is then blended into biofuels, underpinned by the E10 (10% ethanol blend) mandate. Despite the war, ethanol prices have remained relatively stable due to abundance of feedstock (corn). In turn, this limits incentive for farmers to increase corn plantings.
Nitrogen cost pressure is the highest on corn
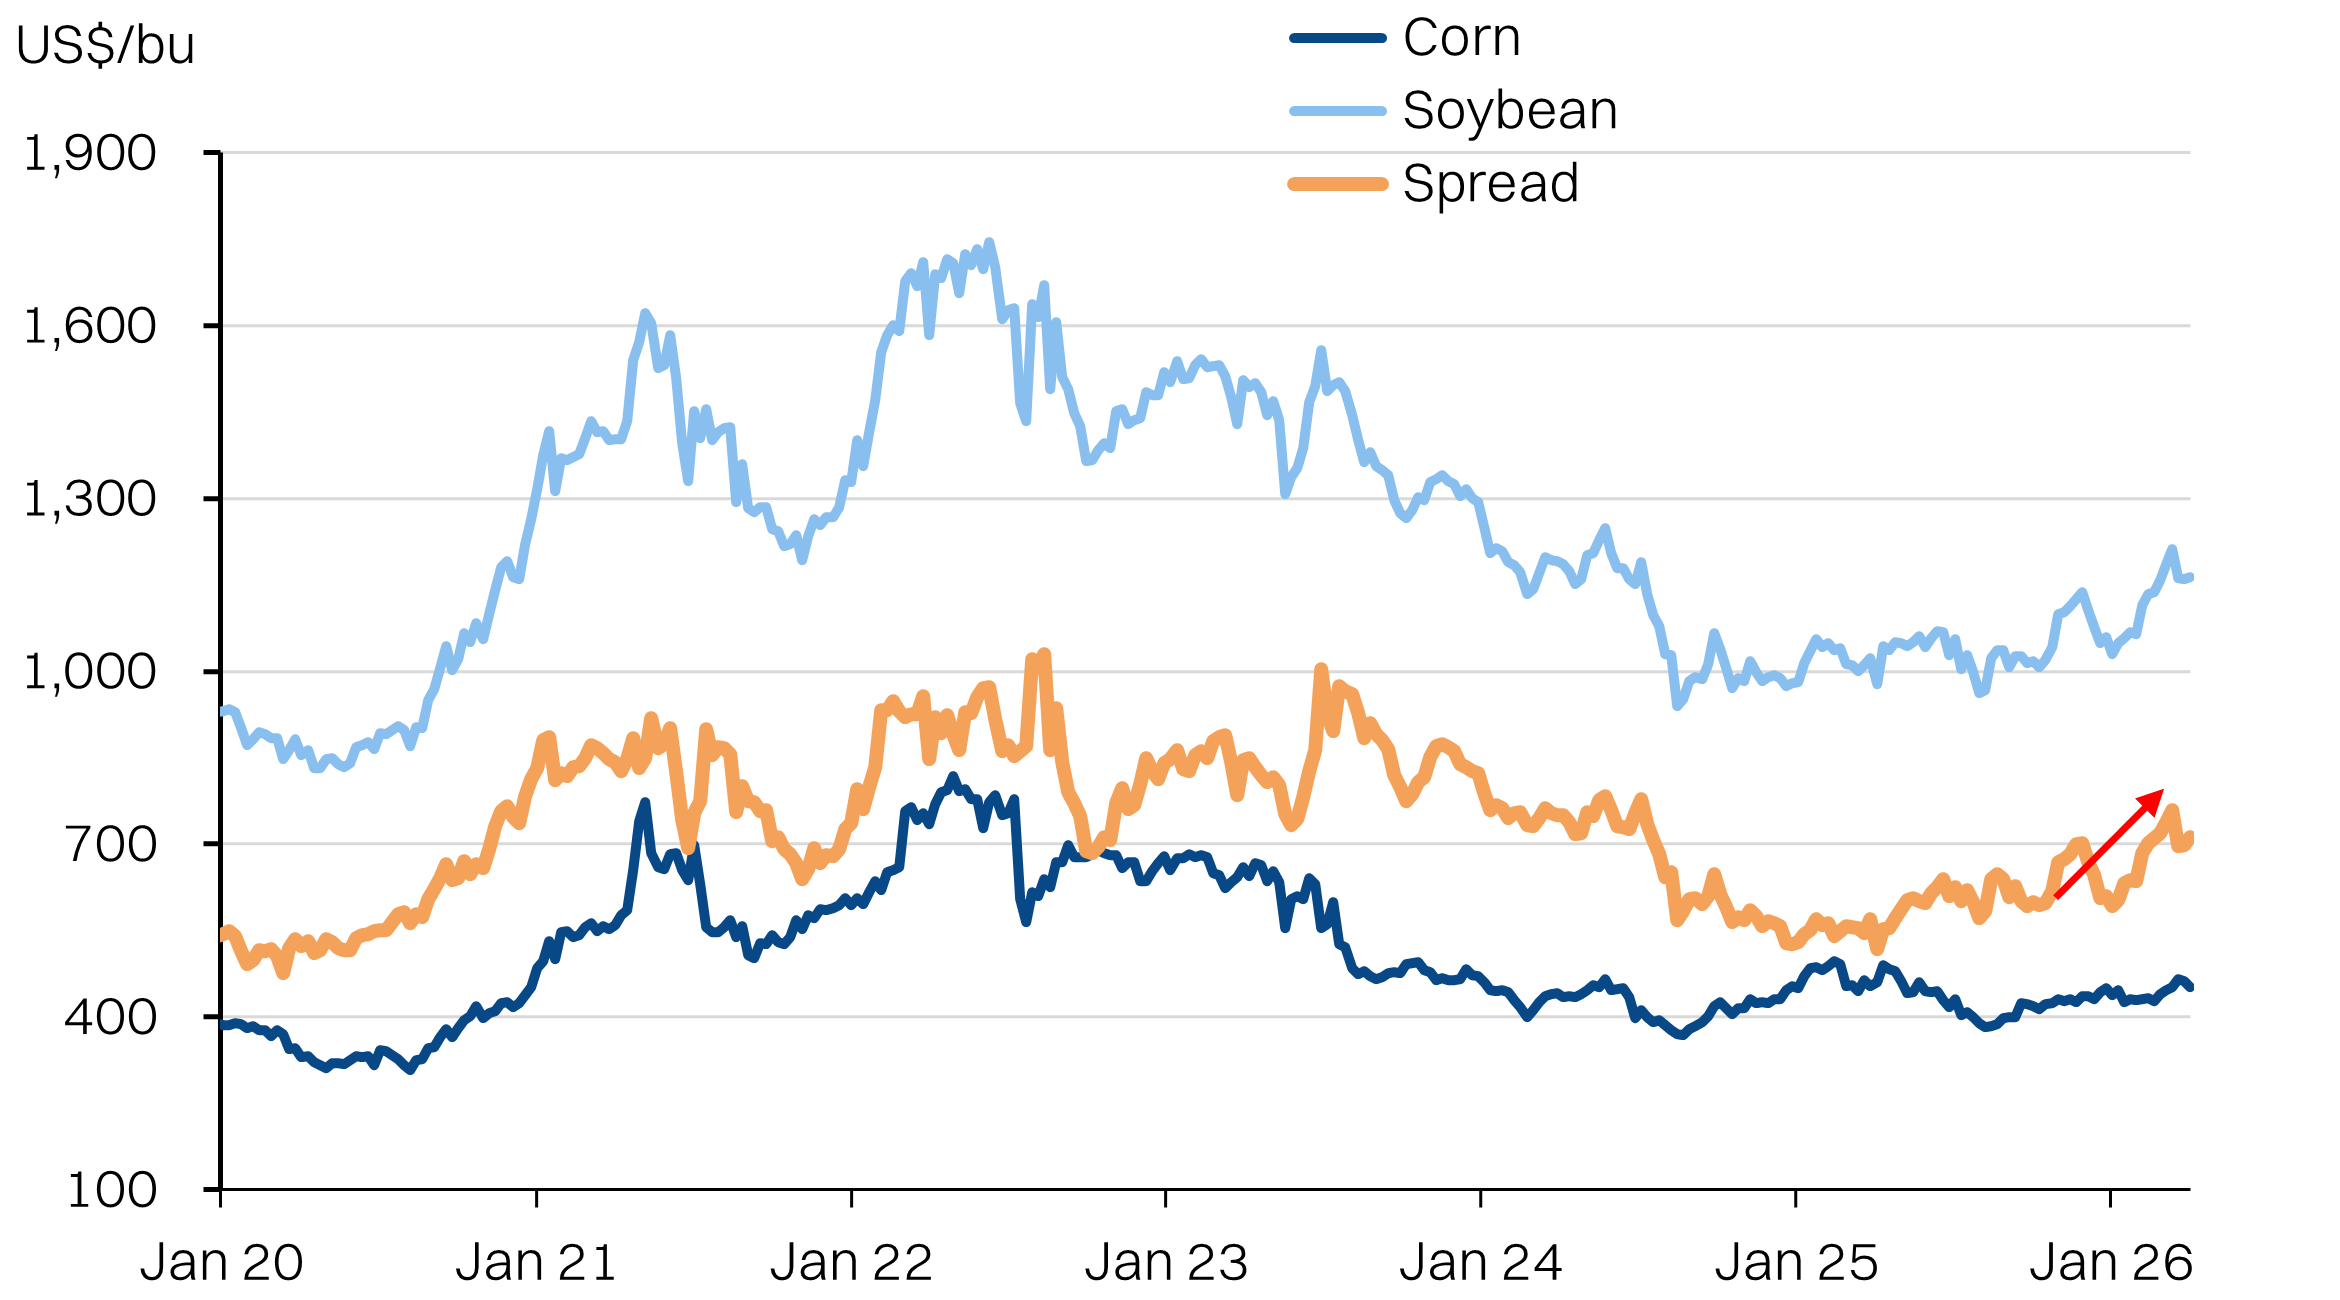
Soybean vs corn prices: growing incentive to switch.
Soybean and corn planting season overlaps
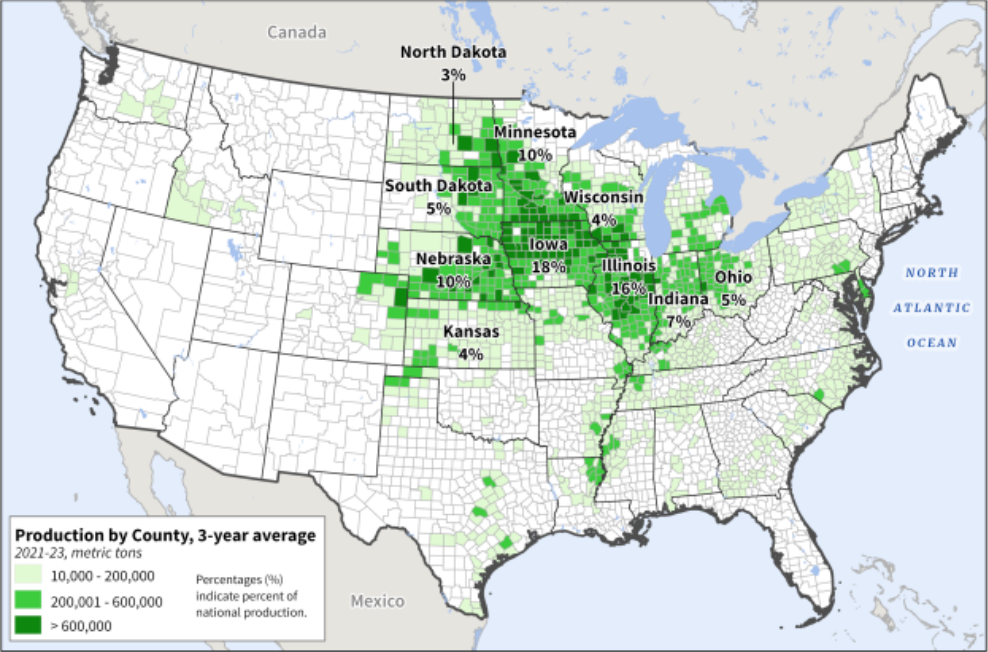
United States corn production
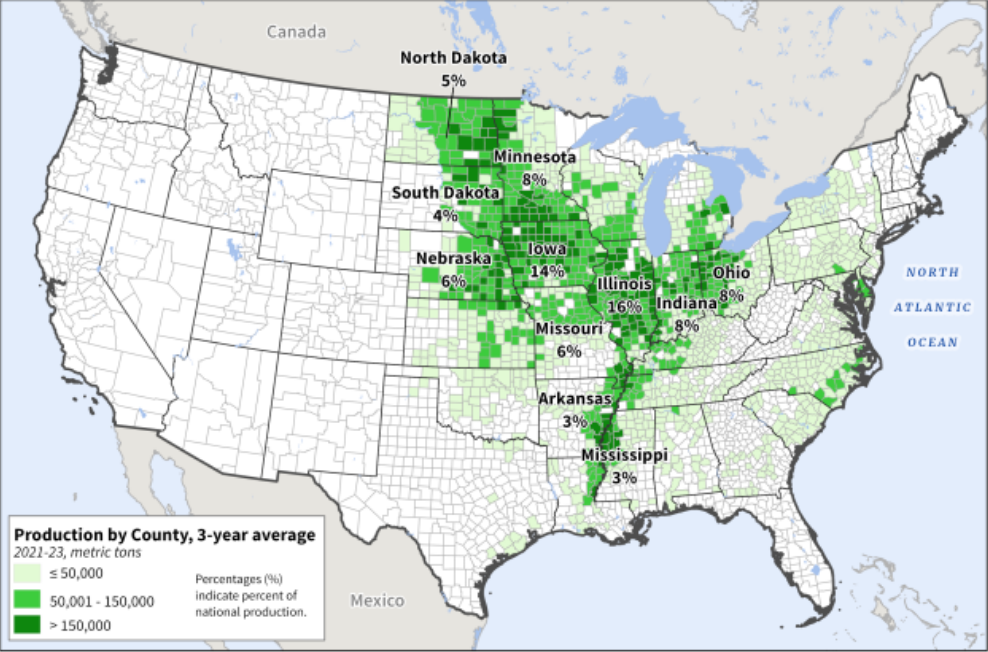
United States soybean production
Corn is an energy crop with >25x more use in biofuels vs soybean oil
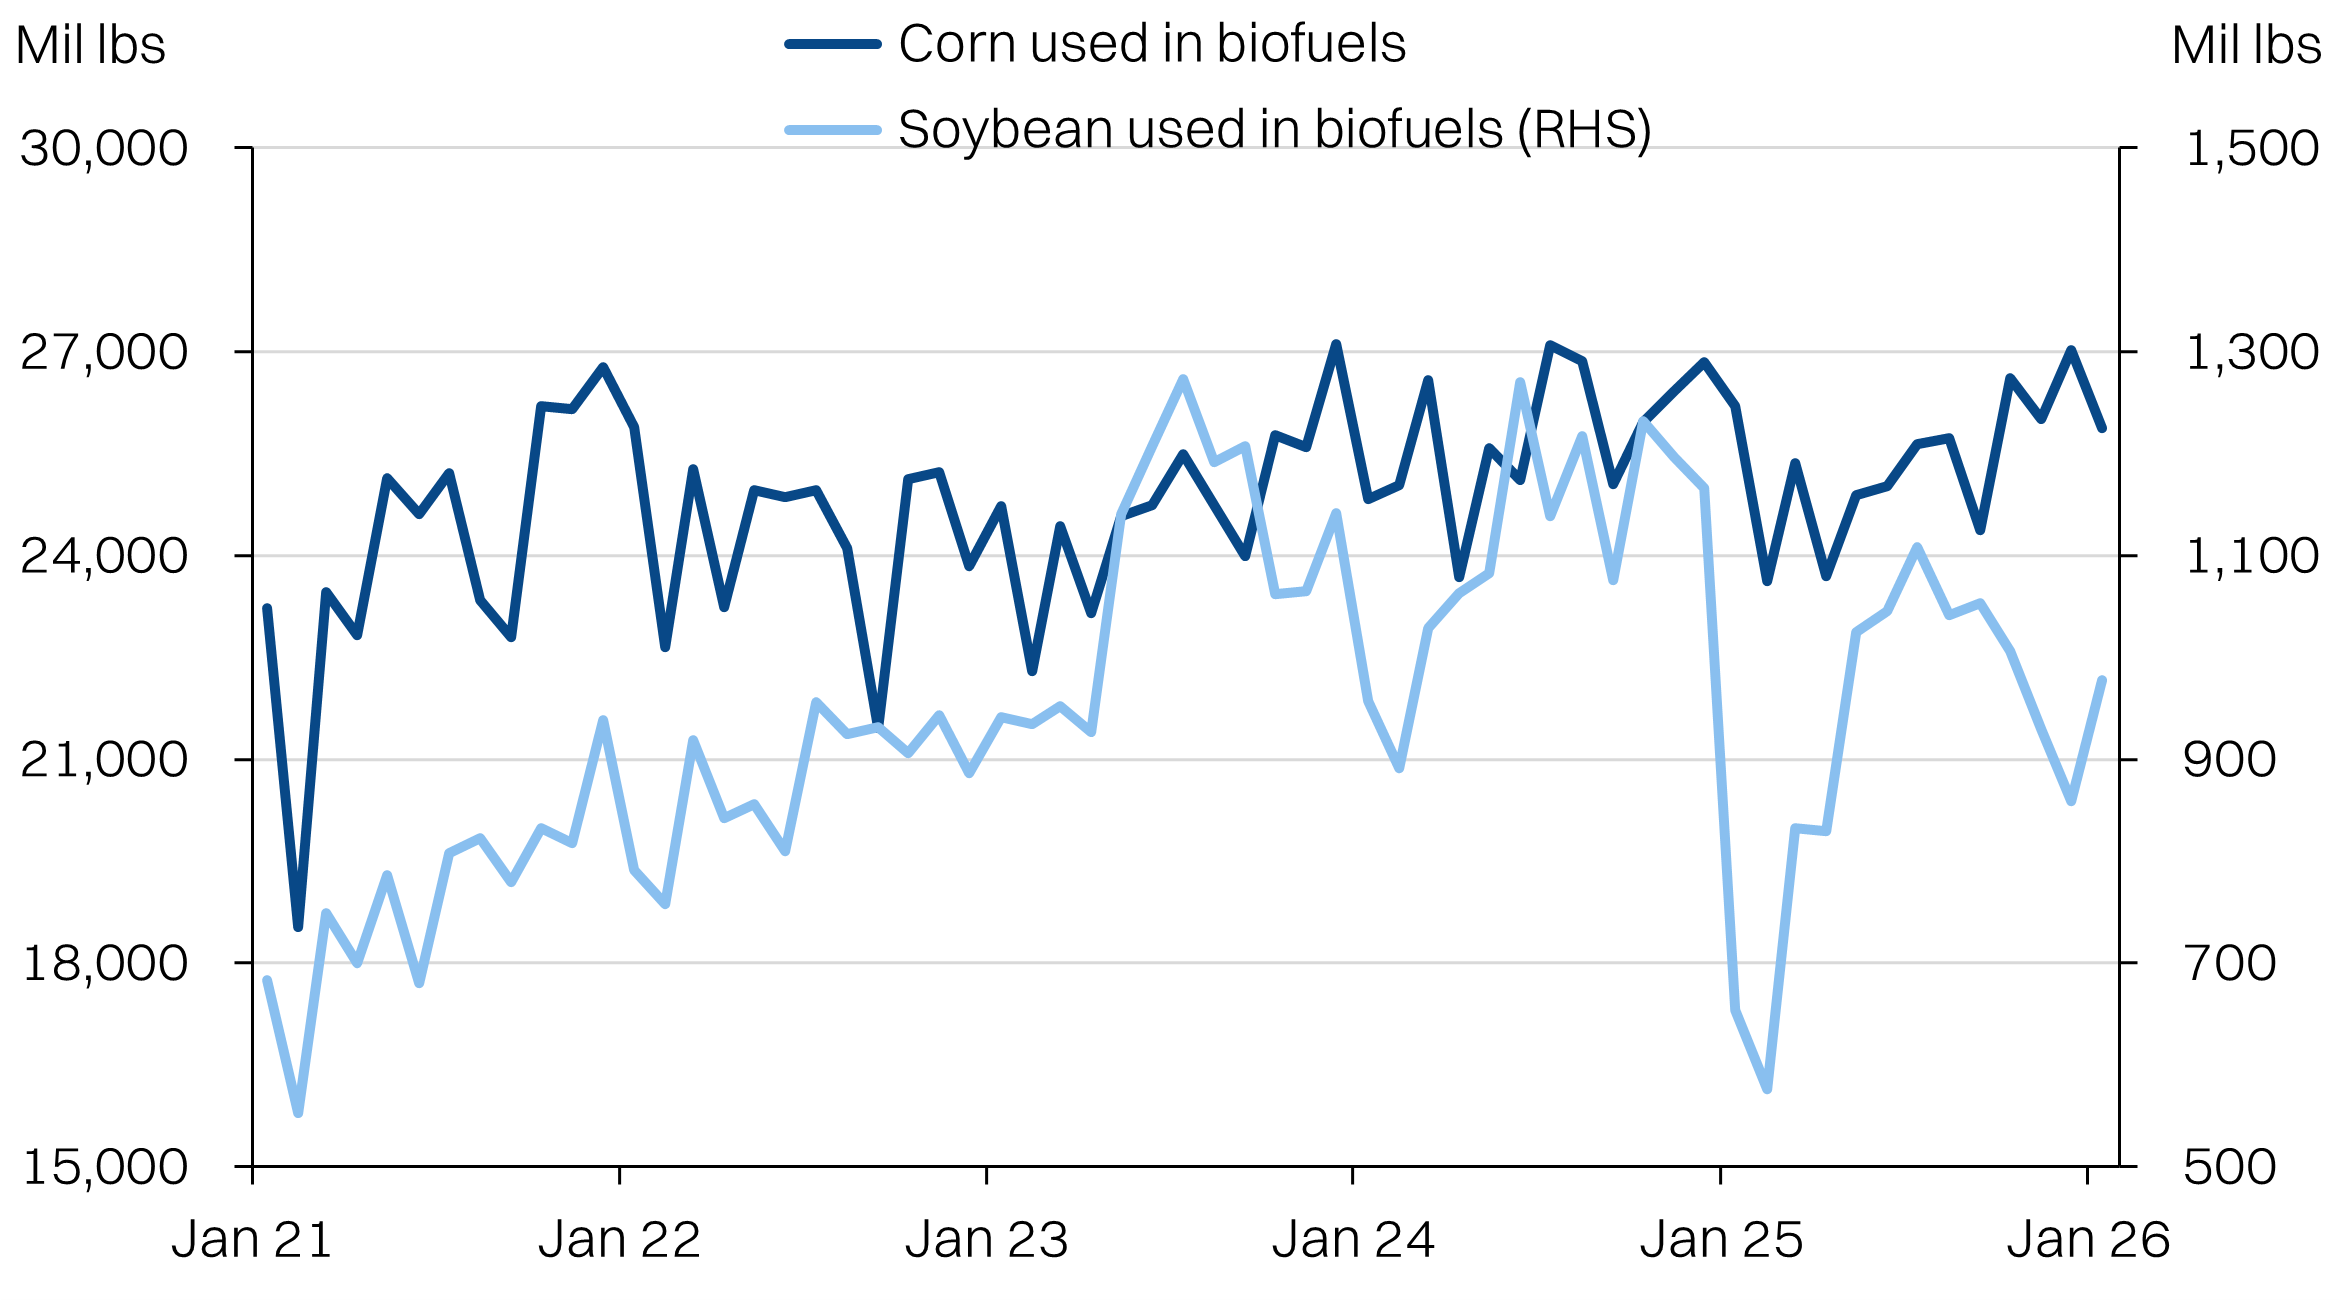
Soybean oil production
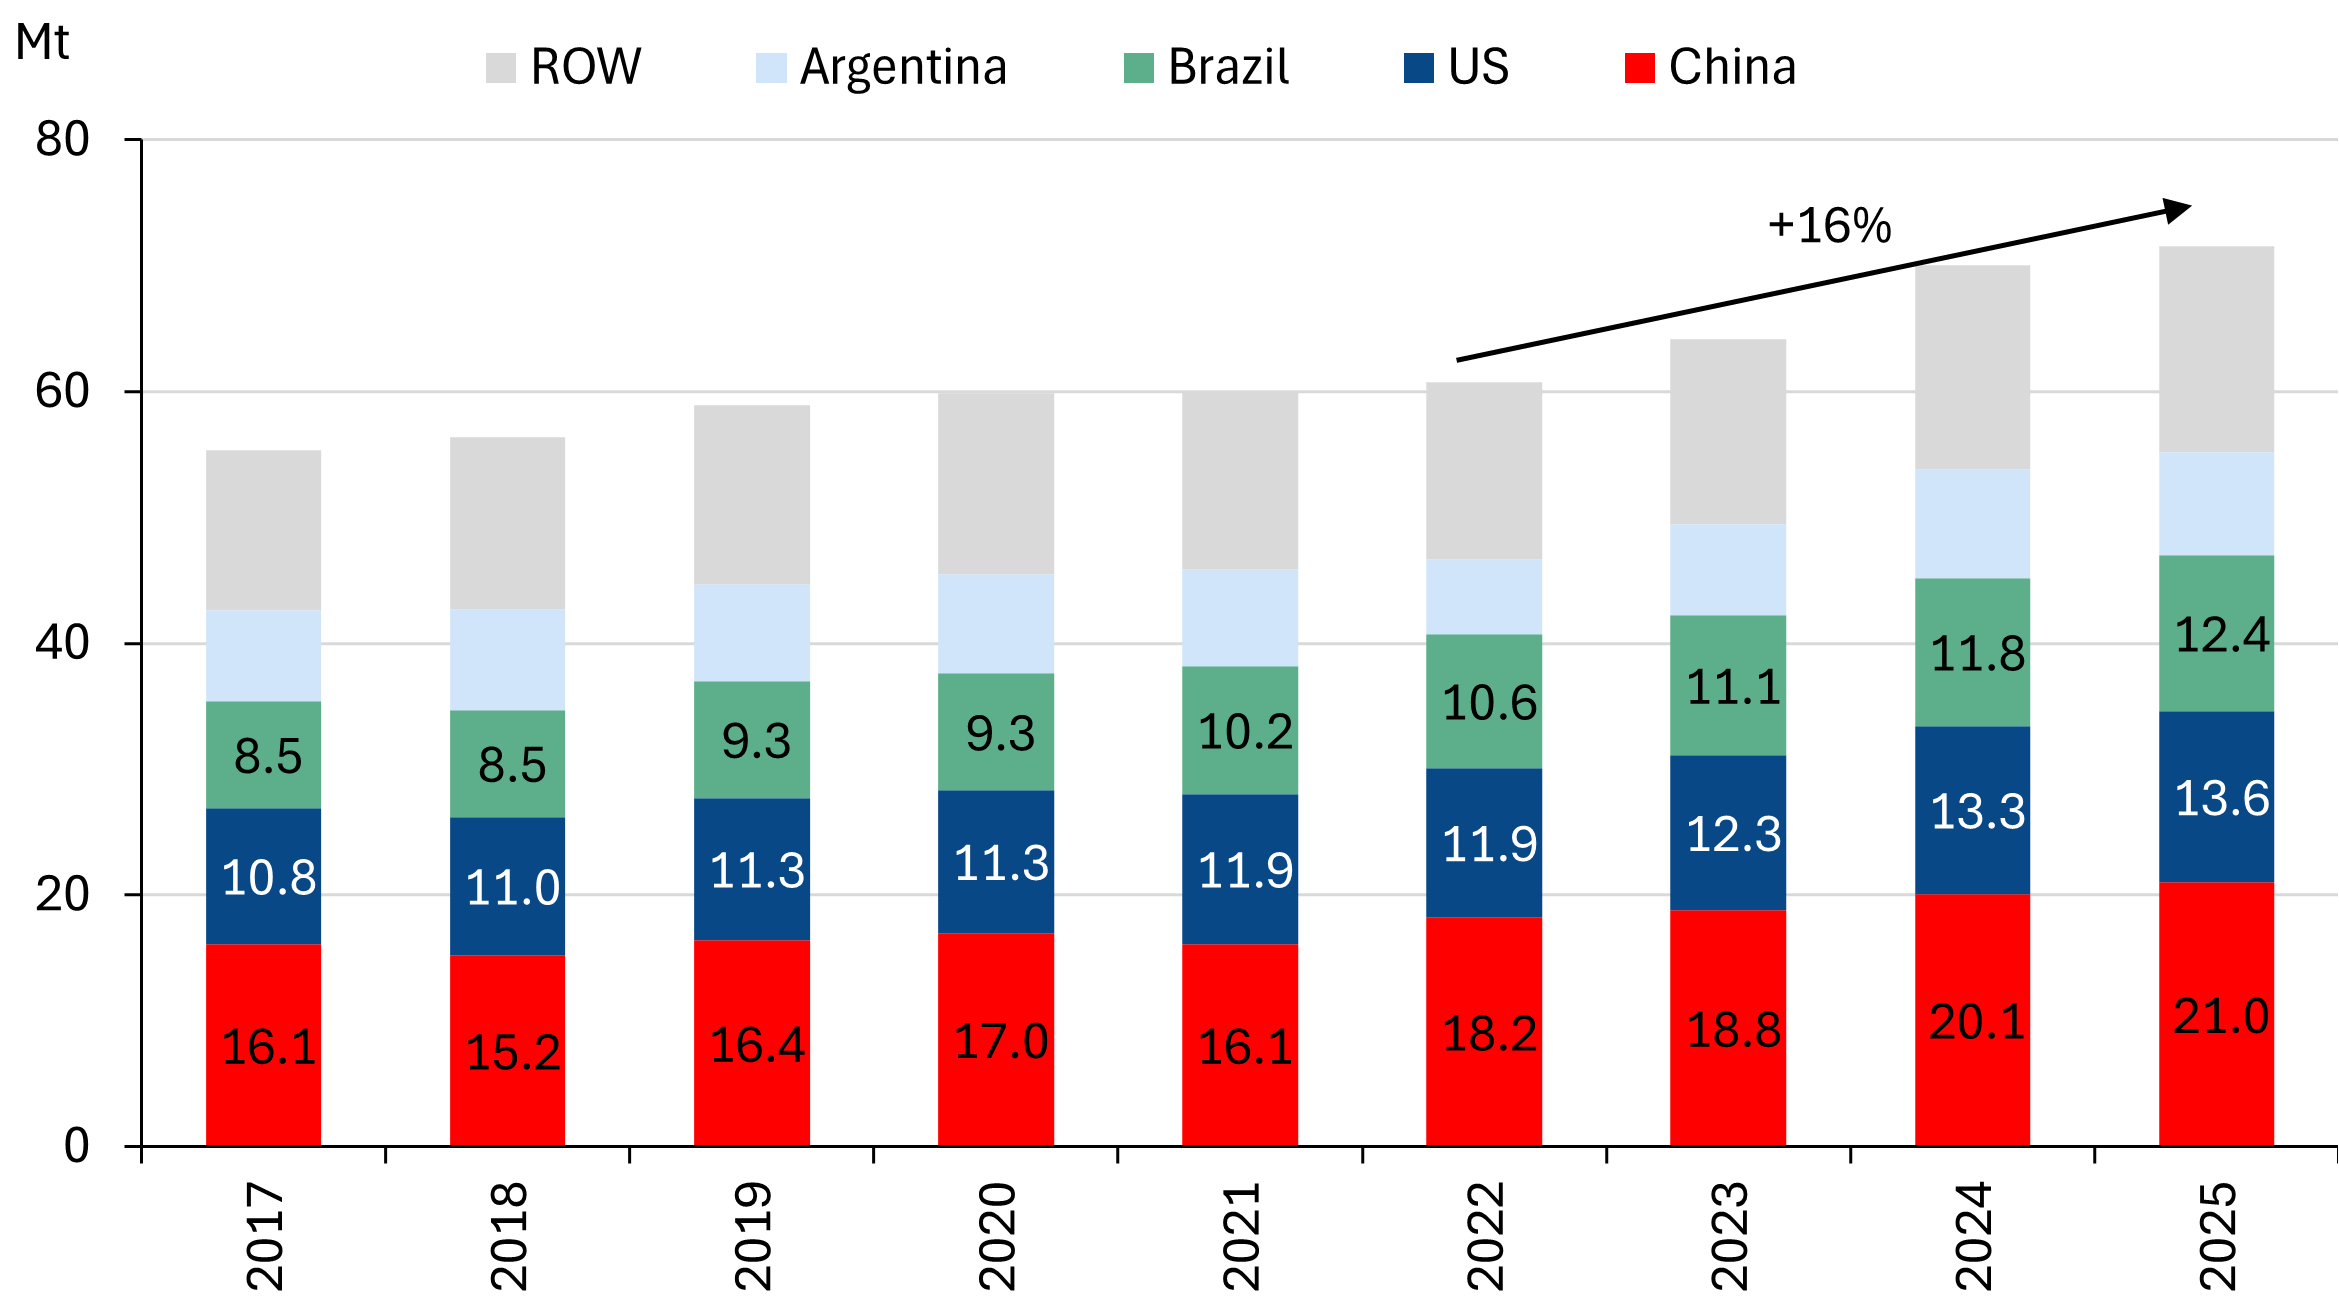
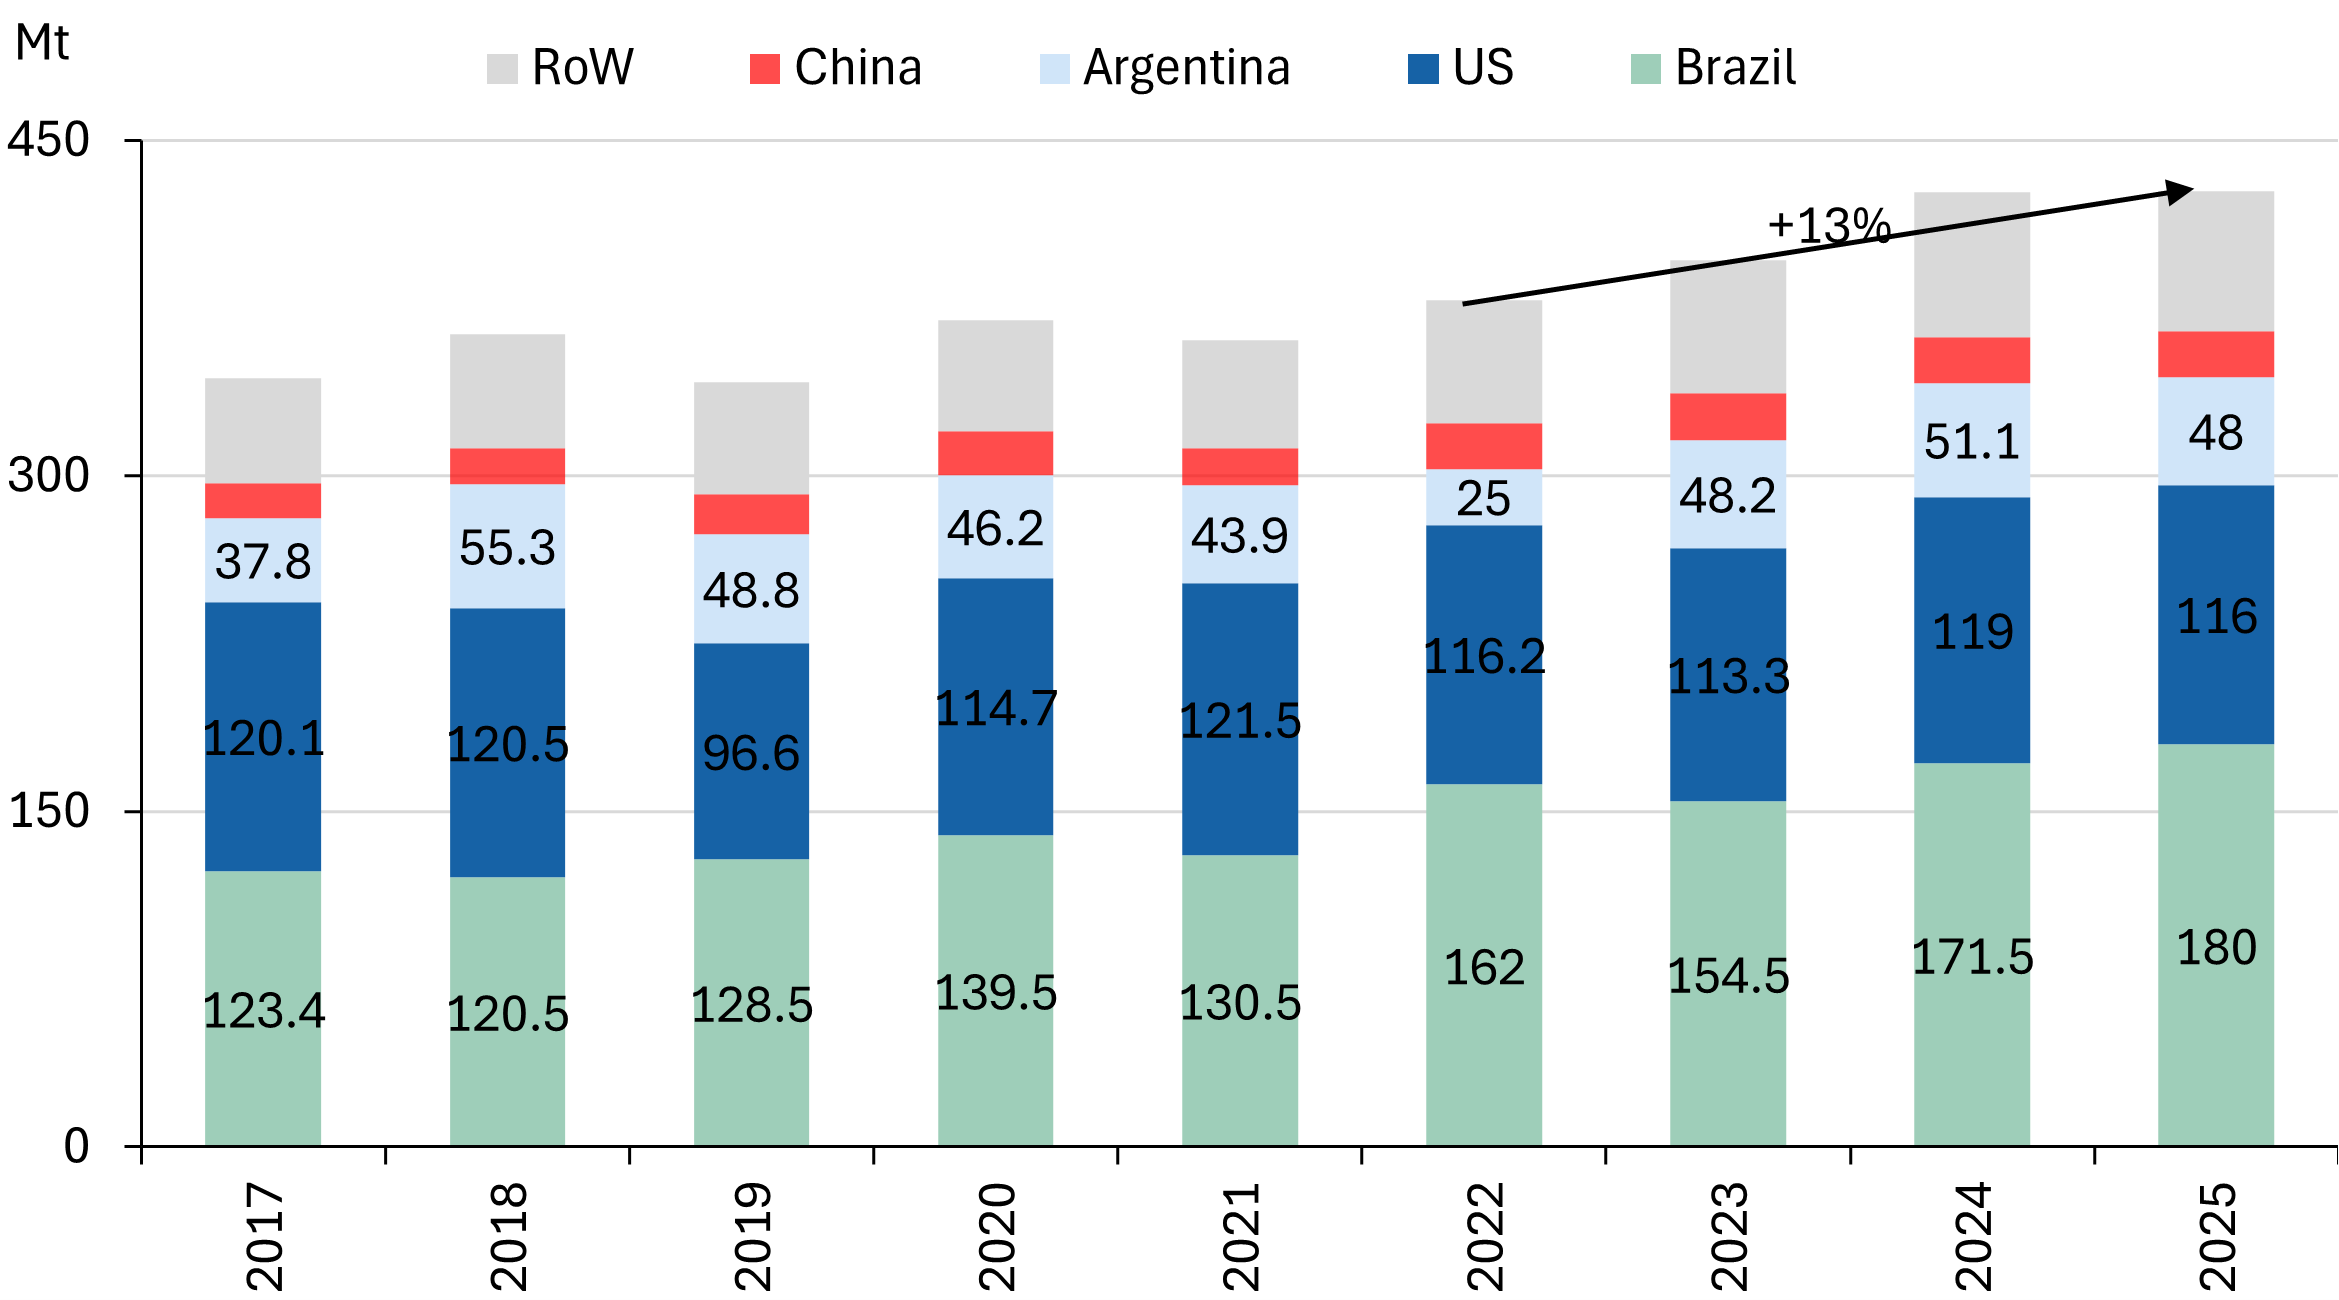
Soybean production
US incremental biofuel demand, substantial but manageable.
The one caveat we would flag, is the growing demand for biofuel in the US driven by the latest biofuel mandates that were finalised last month (link). The policy is aimed to boost US’ rural economy with a headline US$10bn in economic value as the stated intention. It will also recouple the reliance of farmers on Chinese soybean imports amid the trade war backdrop.
The headline increase in biofuel requirements (26/27) is attention-grabbing: +60% vs 2025's baseline. However, note that SBO is only ~32% share of the input mix. Other feedstocks in the pool include canola, rapeseed, and animal fats. Mix will be determined by market forces, so SBO prices can’t be too high either.
Against biomass-based diesel demand (BBD) of 5.4/5.7bn gal (26/27), estimated SBO requirement at current feedstock share would be 6.4/7.9Mt. This is high. But marks a +8%/+34% increase from 2025's estimated demand of 5.9Mt. From a pricing perspective however, the demand is tail loaded to 2H26, due to the timing of policy implementation (June).
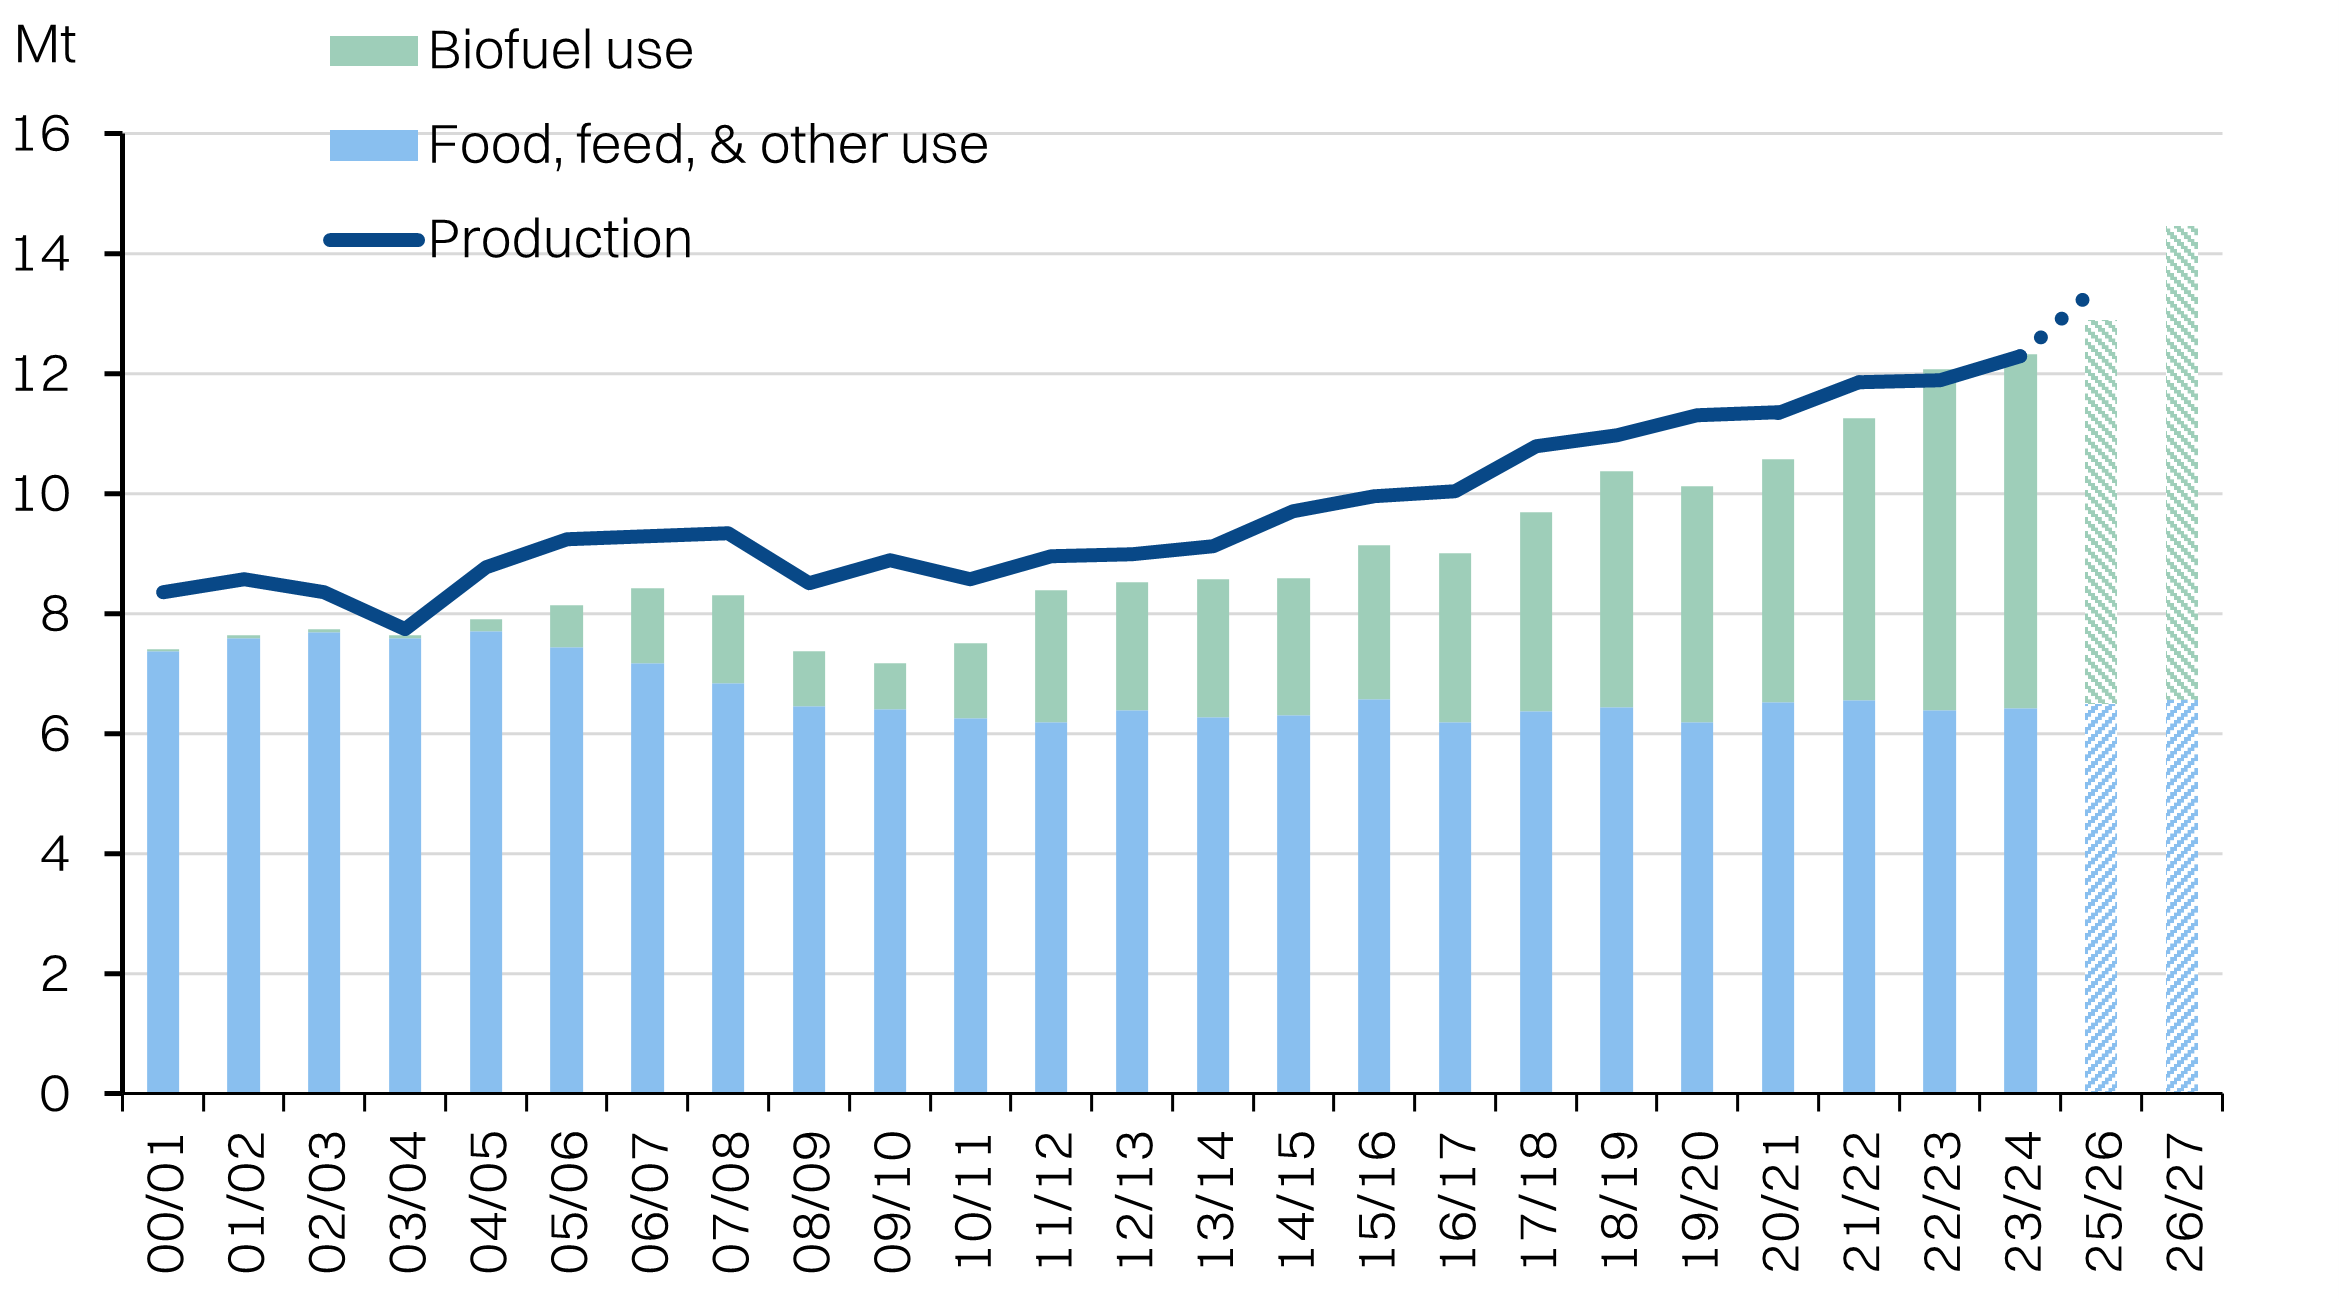
Against this backdrop, the USDA is forecasting (link) US crushing will rise to a record 2.58bn (+5.5% from previous forecast) bushels this year, which will translate to 13.5-13.6Mt of SBO based in the trailing extraction rate (also record highs) of 11.55-11.60lbs/bu. This points to a +10% YoY increase in SBO production for 2026E.
SBO production is slated to keep up with biofuel demand
Impact to CPO prices
We estimate the swing in US soybean planting of +4% will add ~1Mt of supply by the fall of this year, with room to surprise on the upside. Notably, this comes on the back of a good soybean harvest year in Brazil. USDA estimates peg soybean production at 71.4Mt and we see room for this number to surprise on the upside. In the ST, we expect to see stock-to-use ratios continue creeping up, before tightening again in June when the US biofuel mandates come into force. However, a bumper US harvest in fall driven by the higher plantings should drive see stocks replenished towards year end.
At the same time, CPO production is also poised for another solid year on the back of 2025's record high 20Mt. Improved labor availability, maturing estates and normalization of fertiliser application have supported average yields of 17.8MT/ha. We anticipate that stock-to-use ratios are at risk of rising in the next 3-6 months, driven by the potential methanol bottleneck for biodiesel in Indonesia.
Overall, while the war remains fluid, we flag these two dynamics as potential drivers to cap CPO’s strength at around RM4,500/MT.
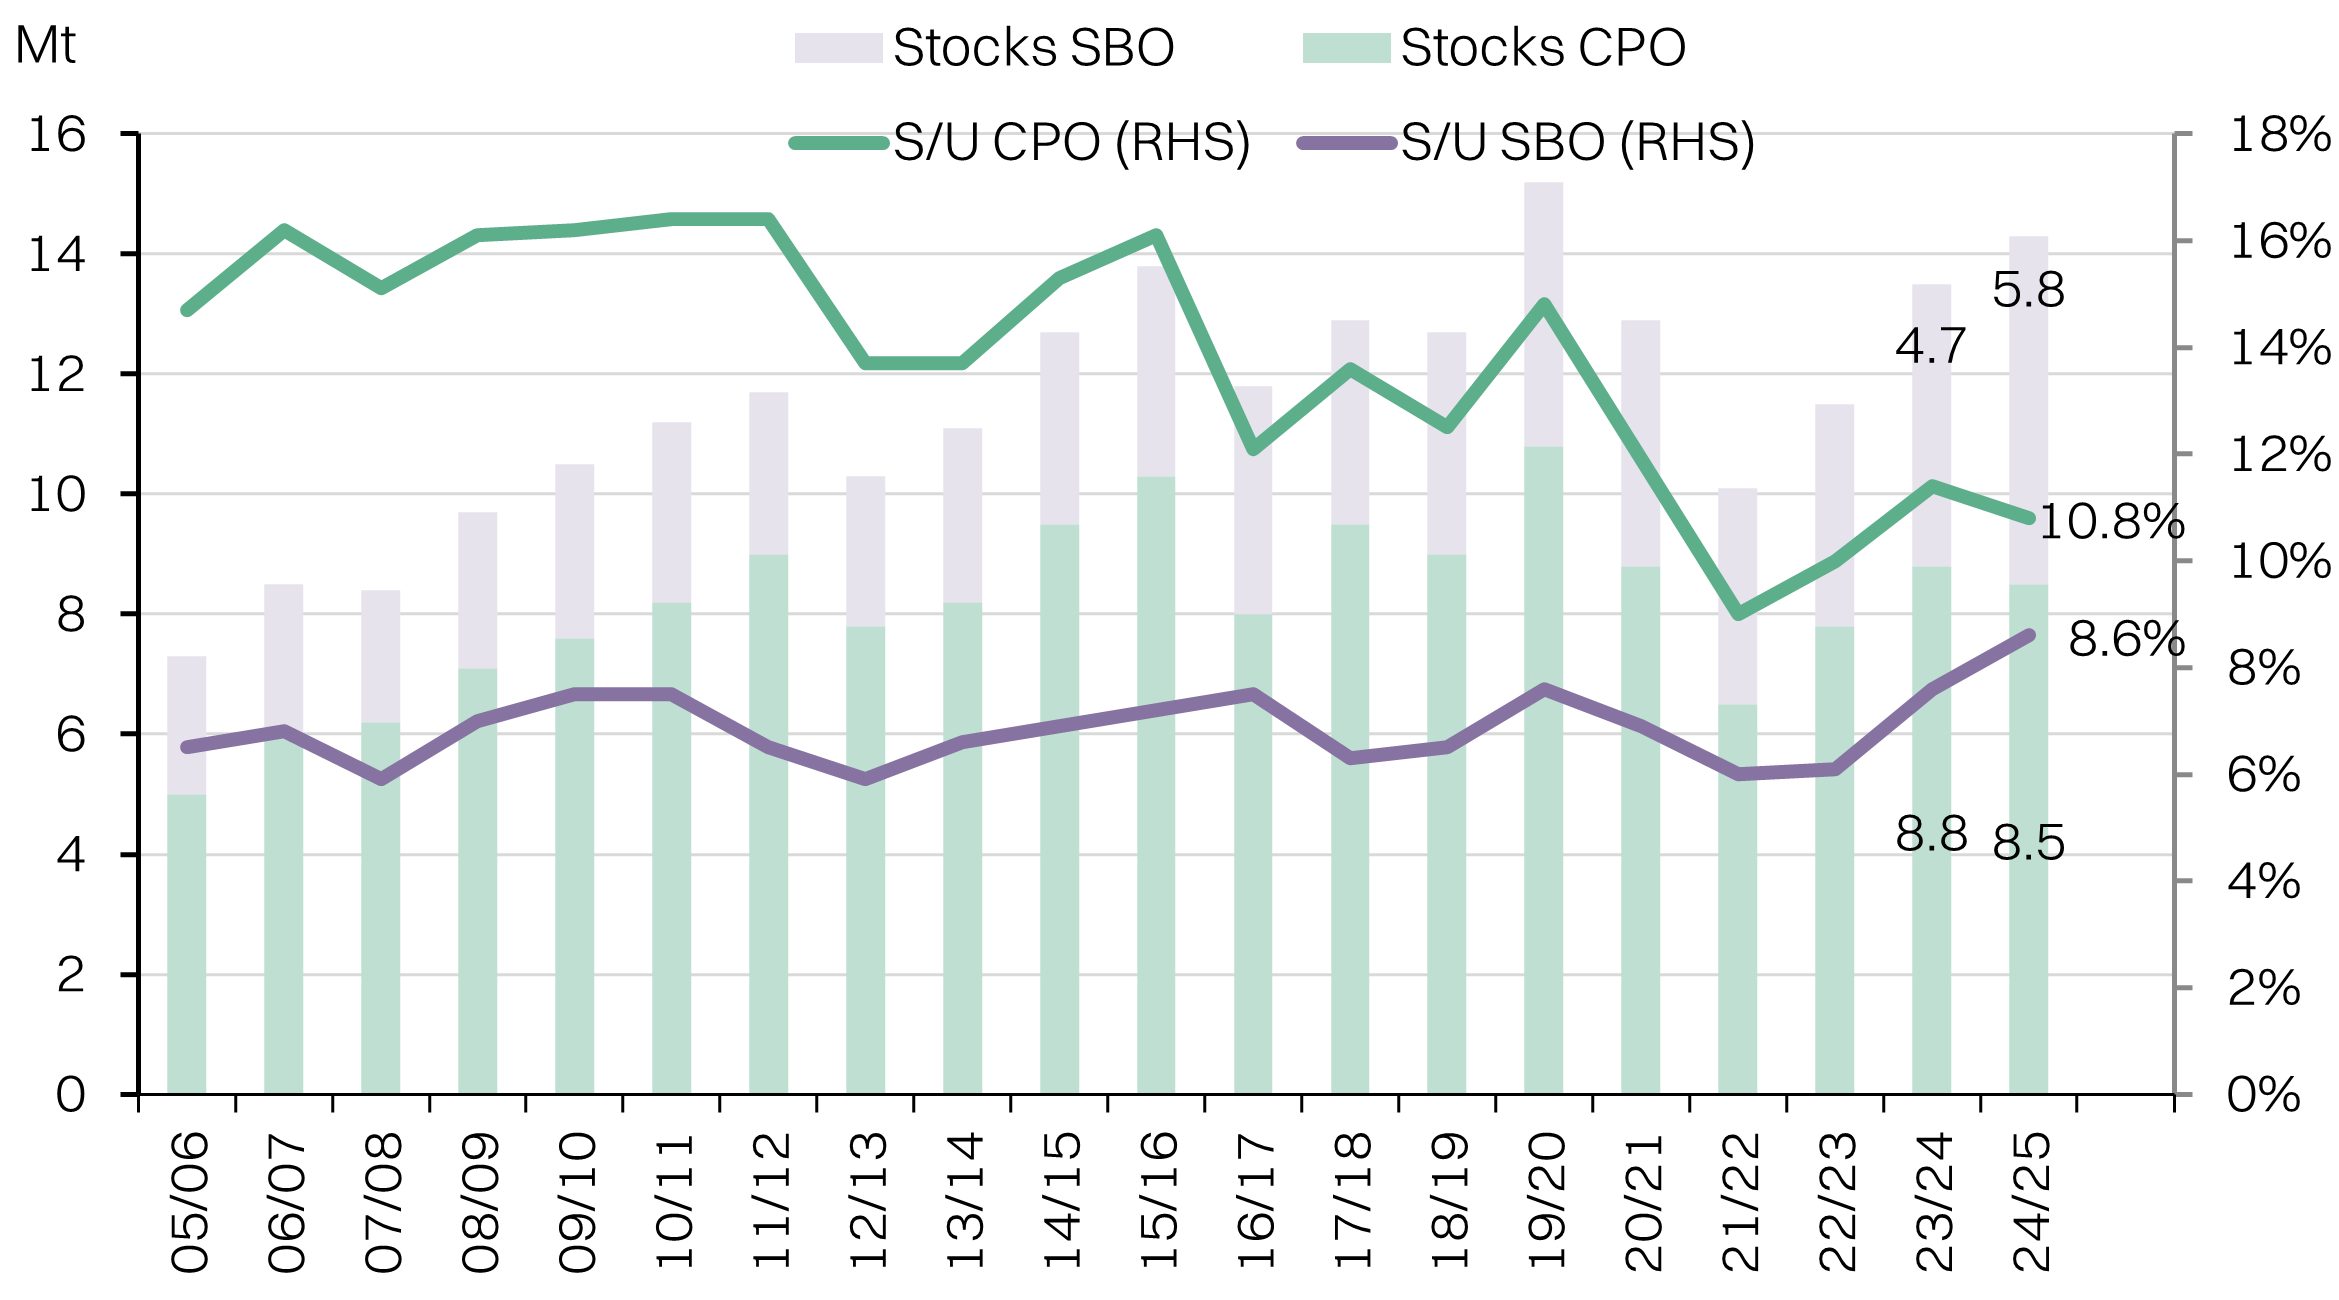
Soybean oil is trading at a premium to CPO
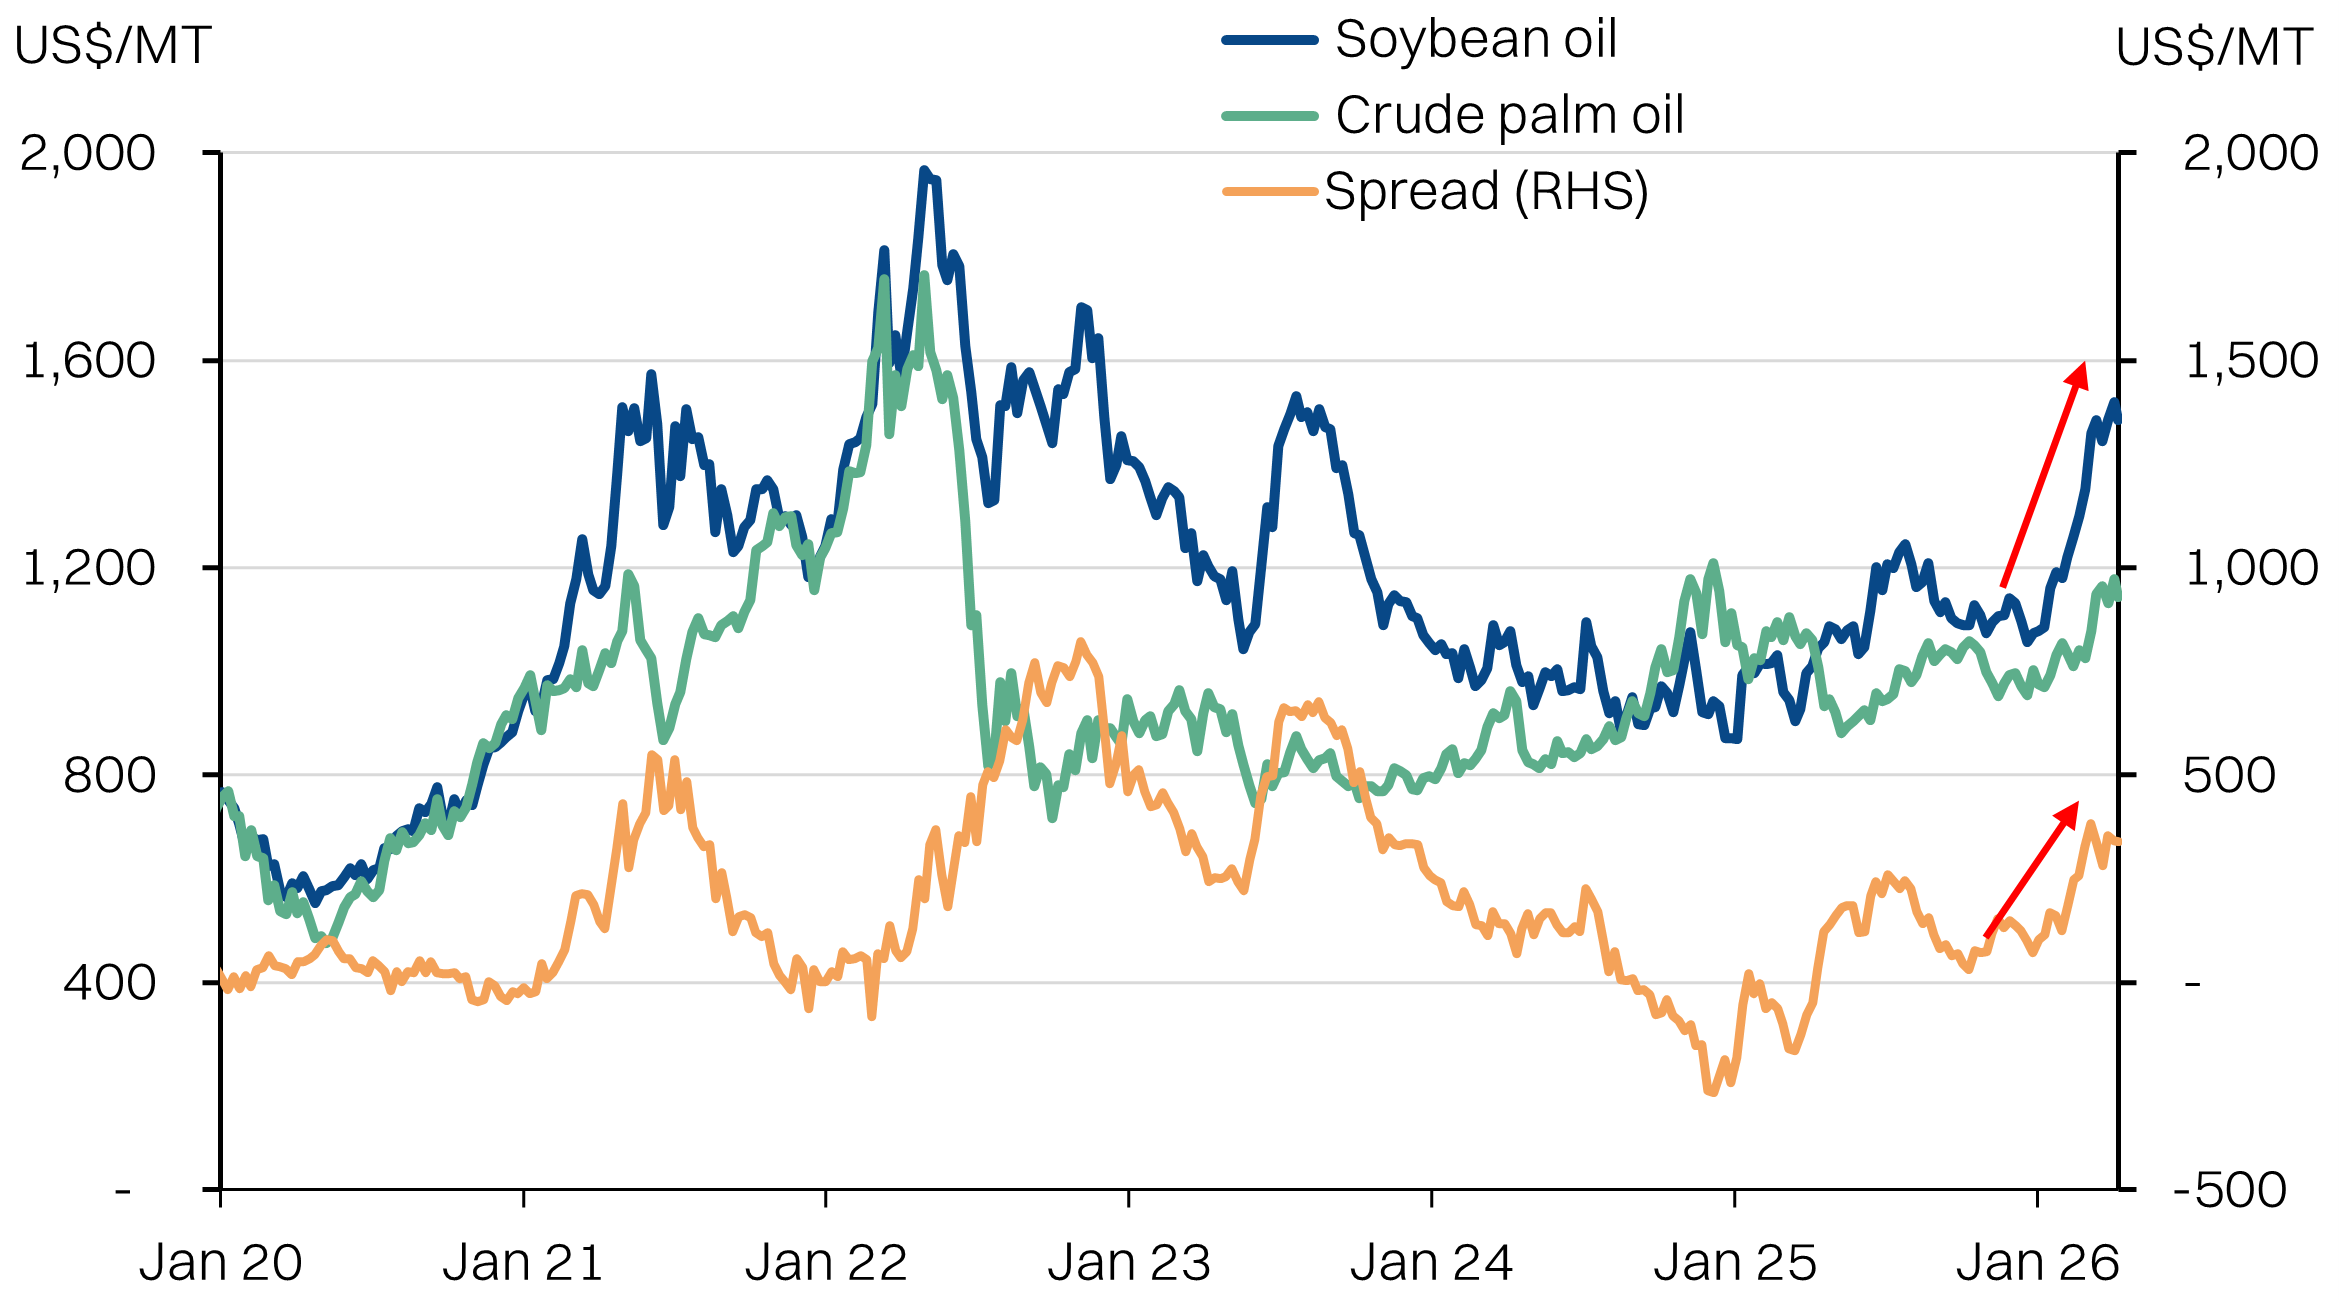
Soybean oil vs CPO stocks
Plantation stocks - tempering a windfall year
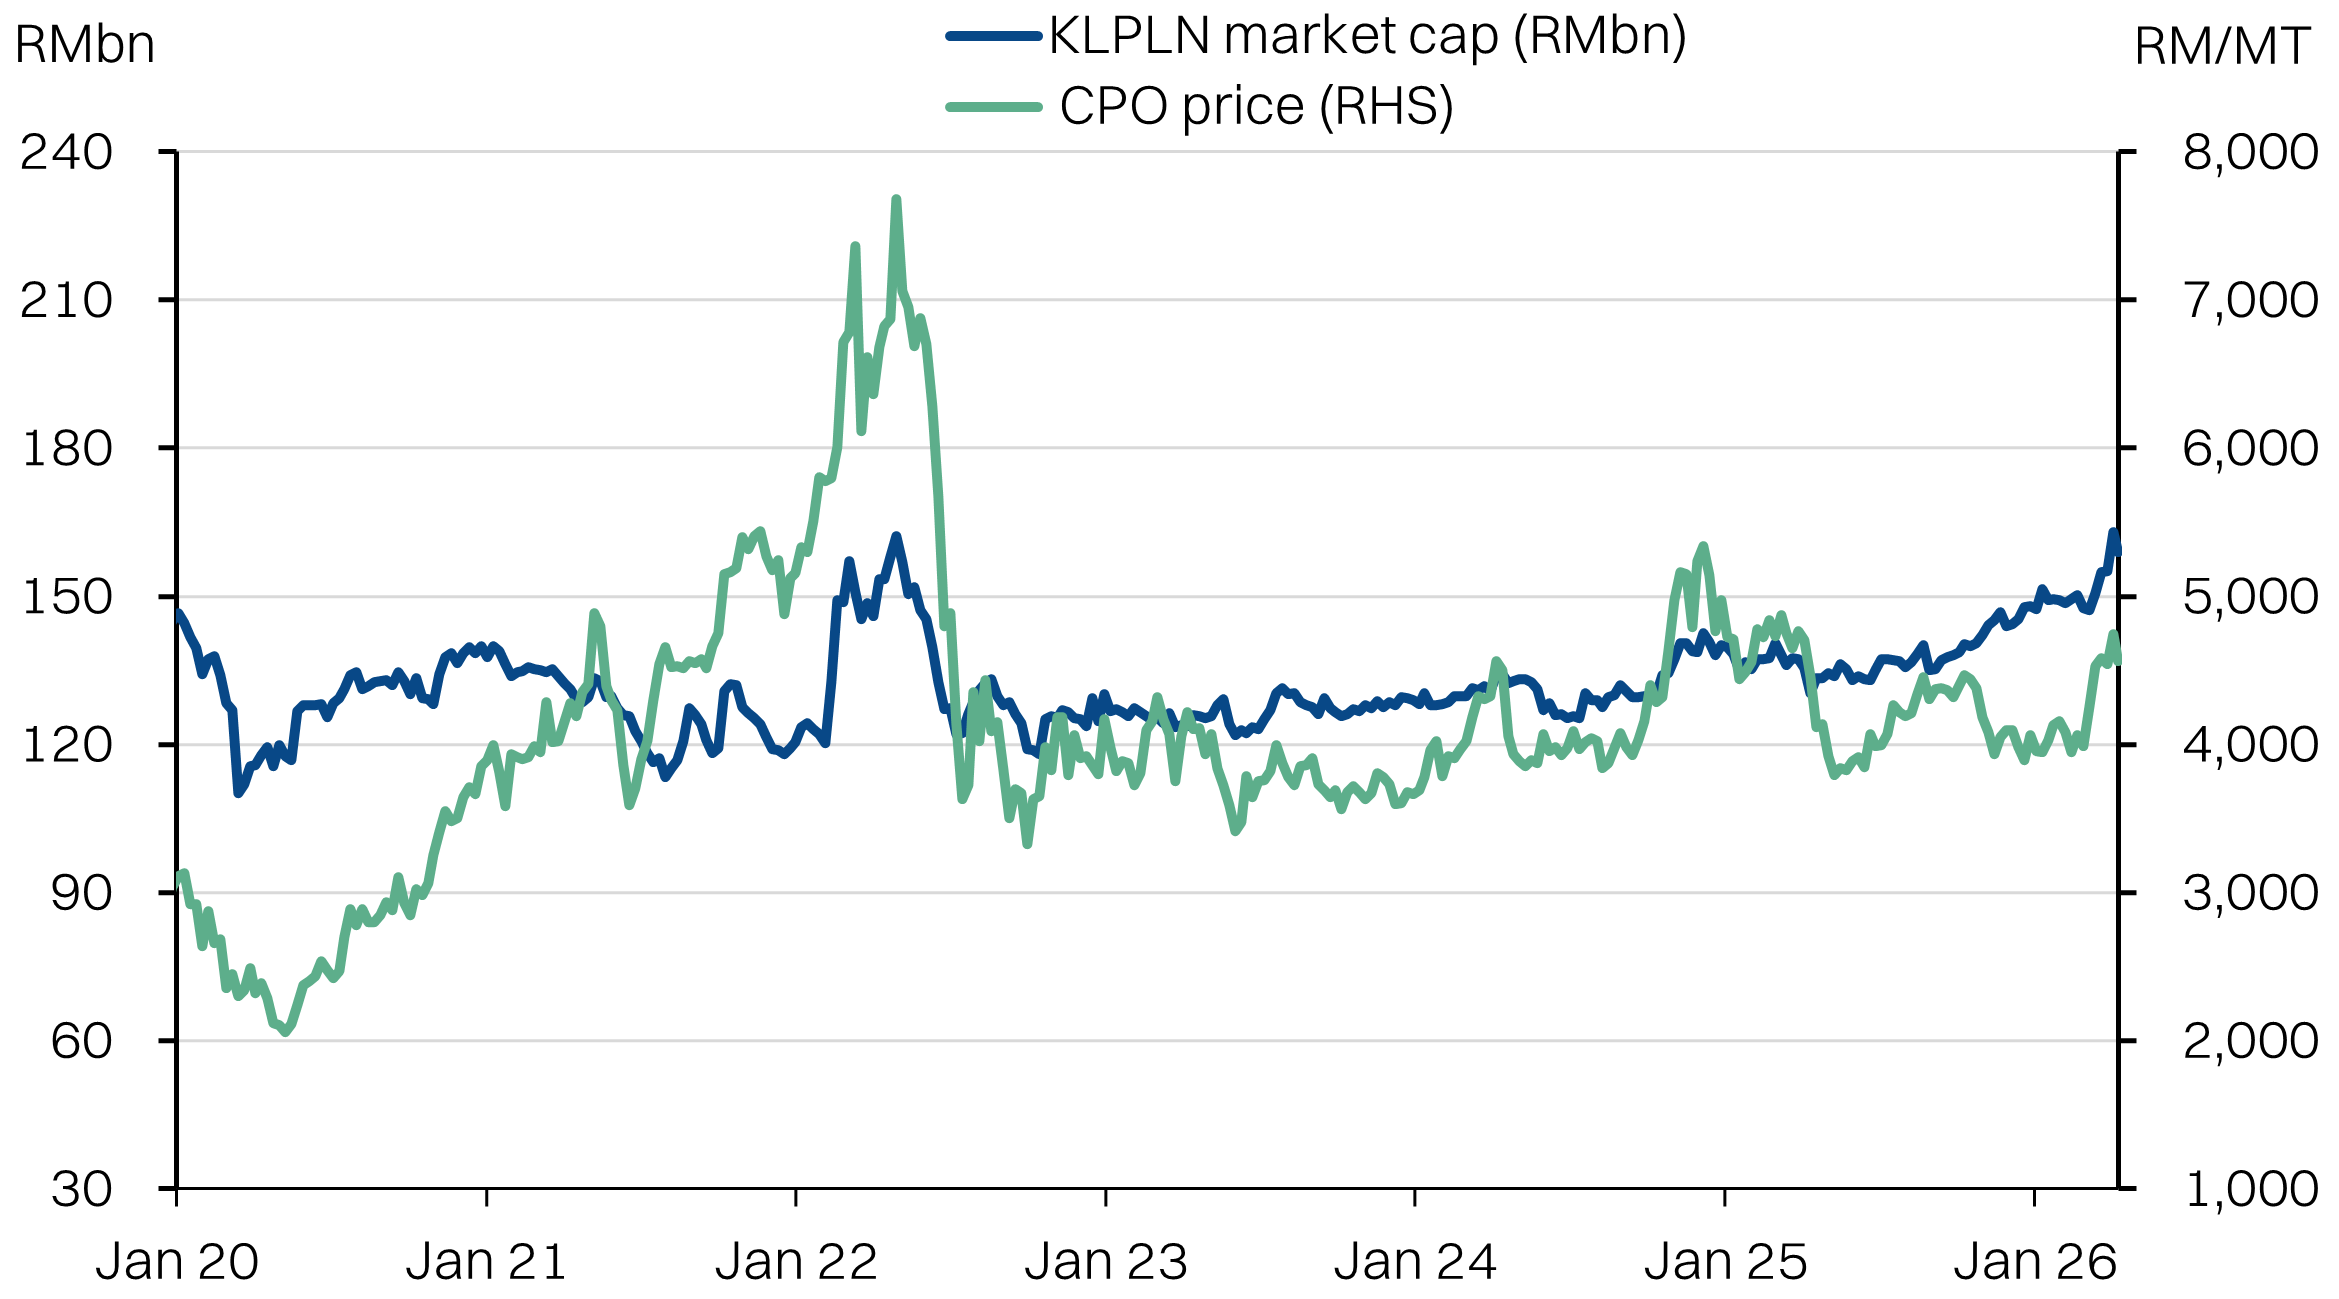
With CPO above RM4,500/MT, there is no doubt that planters will enjoy a windfall year. However, we question if the stocks outperformance against CPO can be sustained, if the commodity prices begin to stall. As we flagged at the start of the report, the KL Plantation Index is up +25% while CPO is up +17% against the trough in May last year. In fact, the market cap of the index is now on-par with the peak seen at the height of the Russia-Ukraine war that saw CPO prices peak at an all-time high of RM4,683/MT, about 62% higher than this year’s high.
KL Plantation index market cap is now on par with the Russia-Ukraine war peak
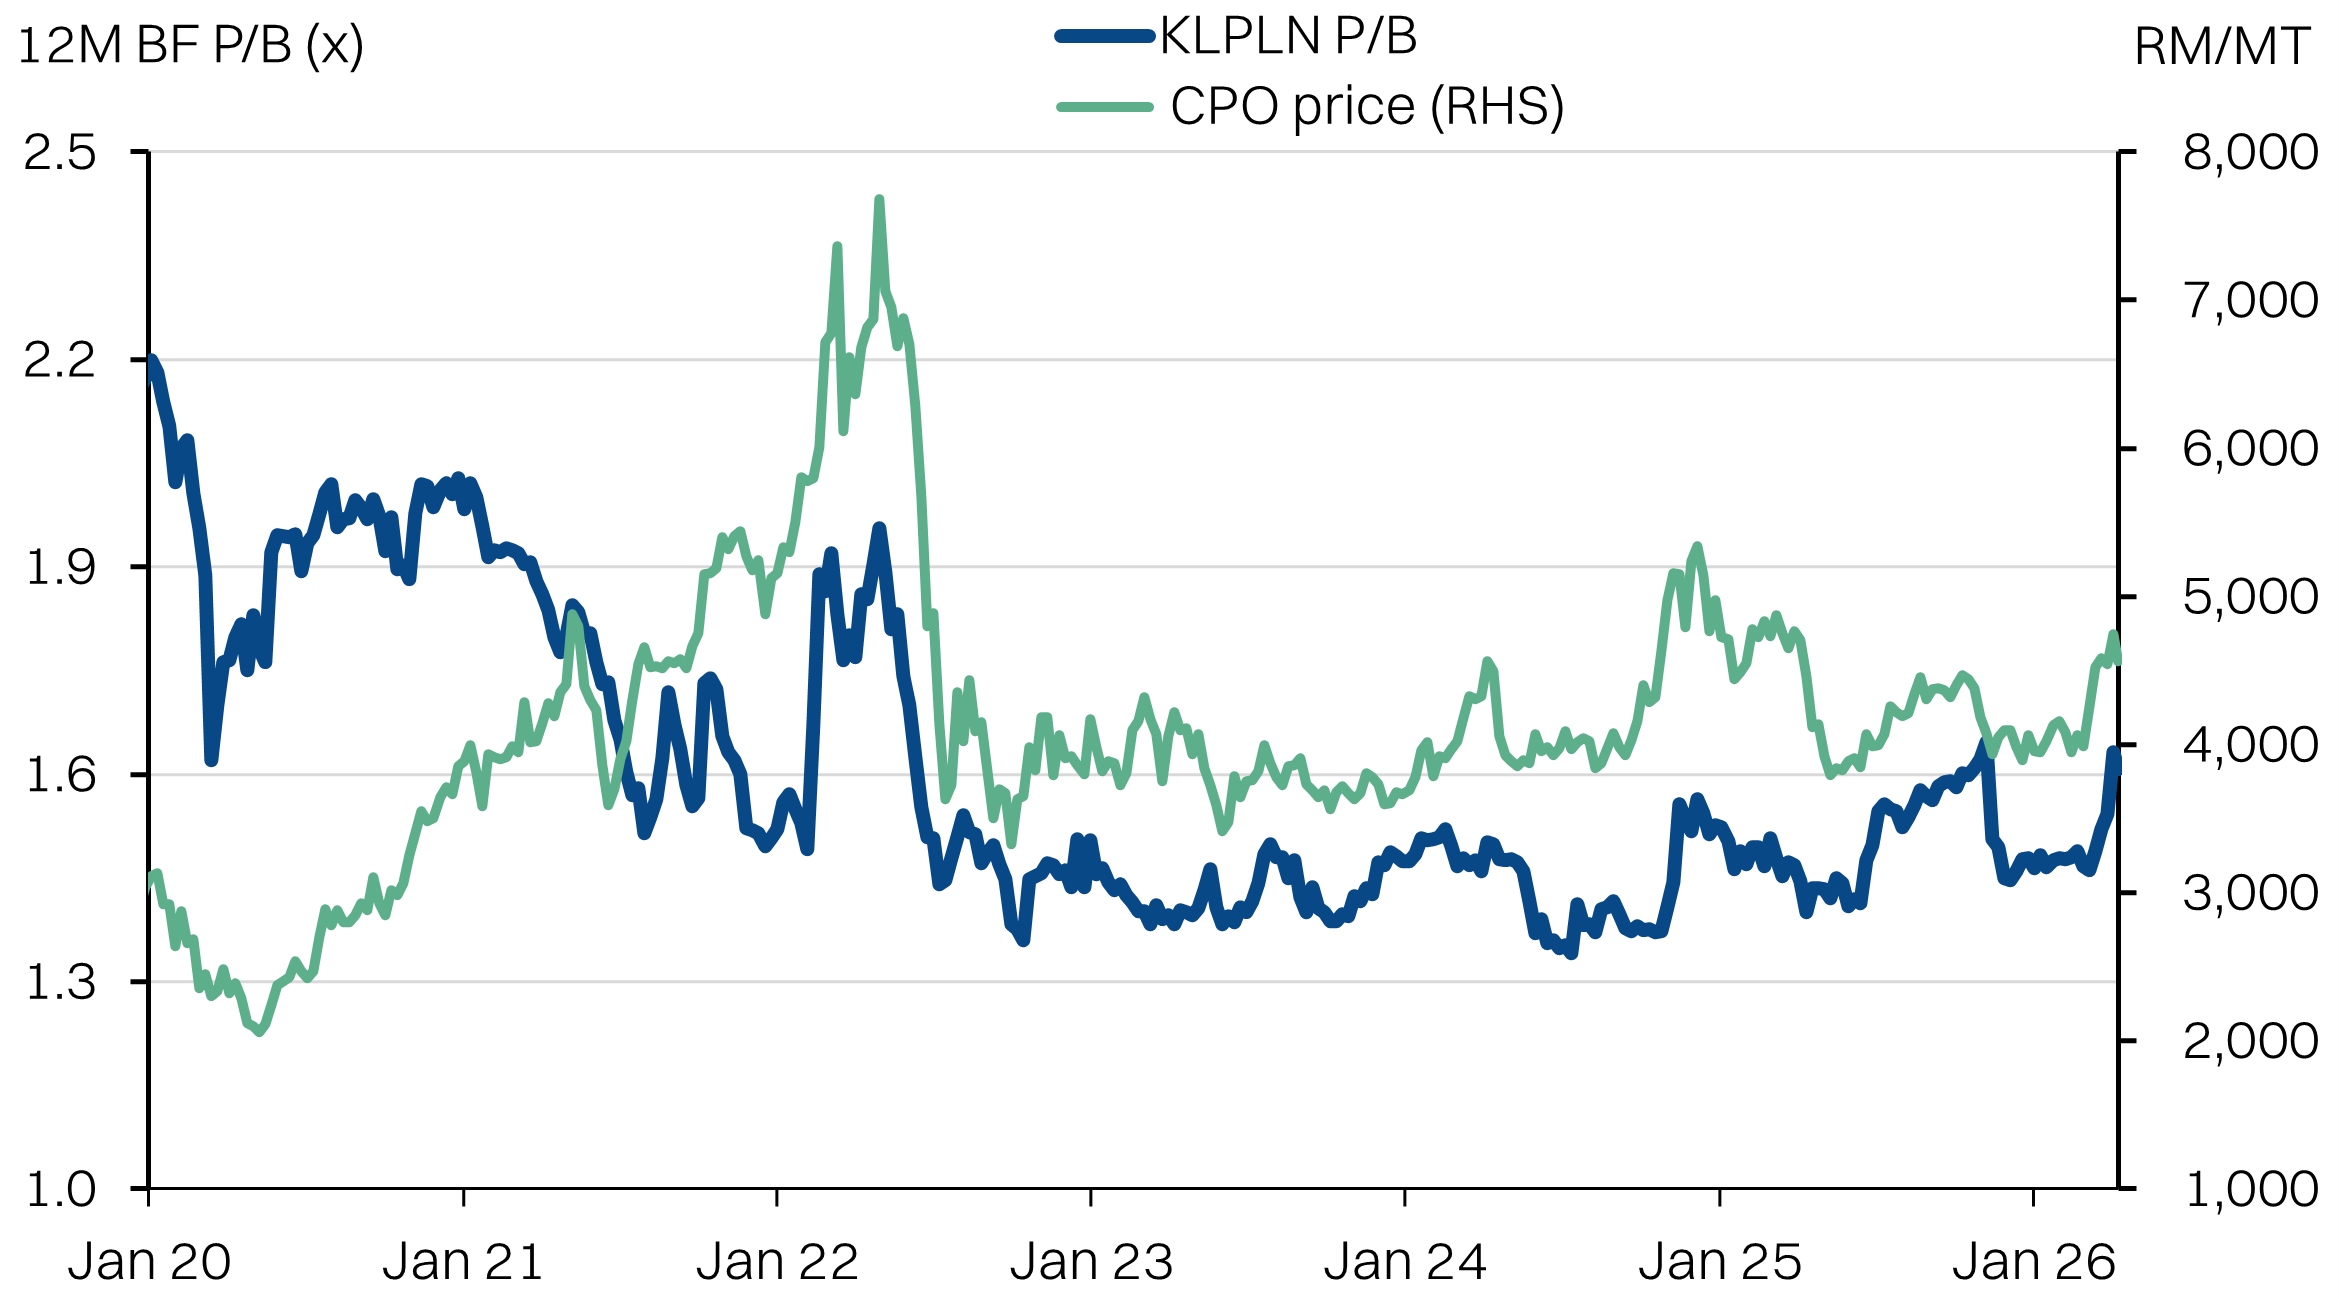
This picture is less alarming when looking at valuations. The index’s price-to-book multiple is near a 4-yr high of 1.6x, but remains below the long-run average of 1.7x. It is above the 3-yr average of 1.5x but that is reasonable given the elevated CPO prices. PER ratios paint a similar picture, at 16.8x 12MBF PER, the index is still below the long-run average of 19.4x but slightly above the 3yr average of 16.4x.
Yields are another critical benchmark for the sector. Index yields are now at 3.05%, which is compressed from the 3yr average of 3.39%. However, it remains above the long-run average of 2.98%.
KL Plantation index valuations are less stretched.
The other consideration when looking at valuations is the relatively slow adjustments to consensus expectations. Unlike the pre-2023, where sectoral earnings expectations closely-tracked CPO prices, the war has not actually driven an upgrade, yet.
However, that upgrade might not be forthcoming. There was a ~13.5% upgrade to consensus earnings expectations in 3Q25, but it appears wrong-footed in hindsight as CPO prices subsequently fell. However, assumptions were not revised. Consequently, this might also be the reason broader earnings upgrades for the sector have not materialised despite 6 weeks of war and >RM4,500/MT CPO.
If anything, the one shock that is not yet included into the numbers are the higher fertiliser costs, as well as other cost inflation arising from the war. However, we do note that earnings downgrades tend to be slower than the earnings upgrades, and expectations could remain inflated for the next 2-3 quarters before the margin pressure emerges.
We think this dynamic should push investors to focus more on planters with higher yields as well as higher margins.
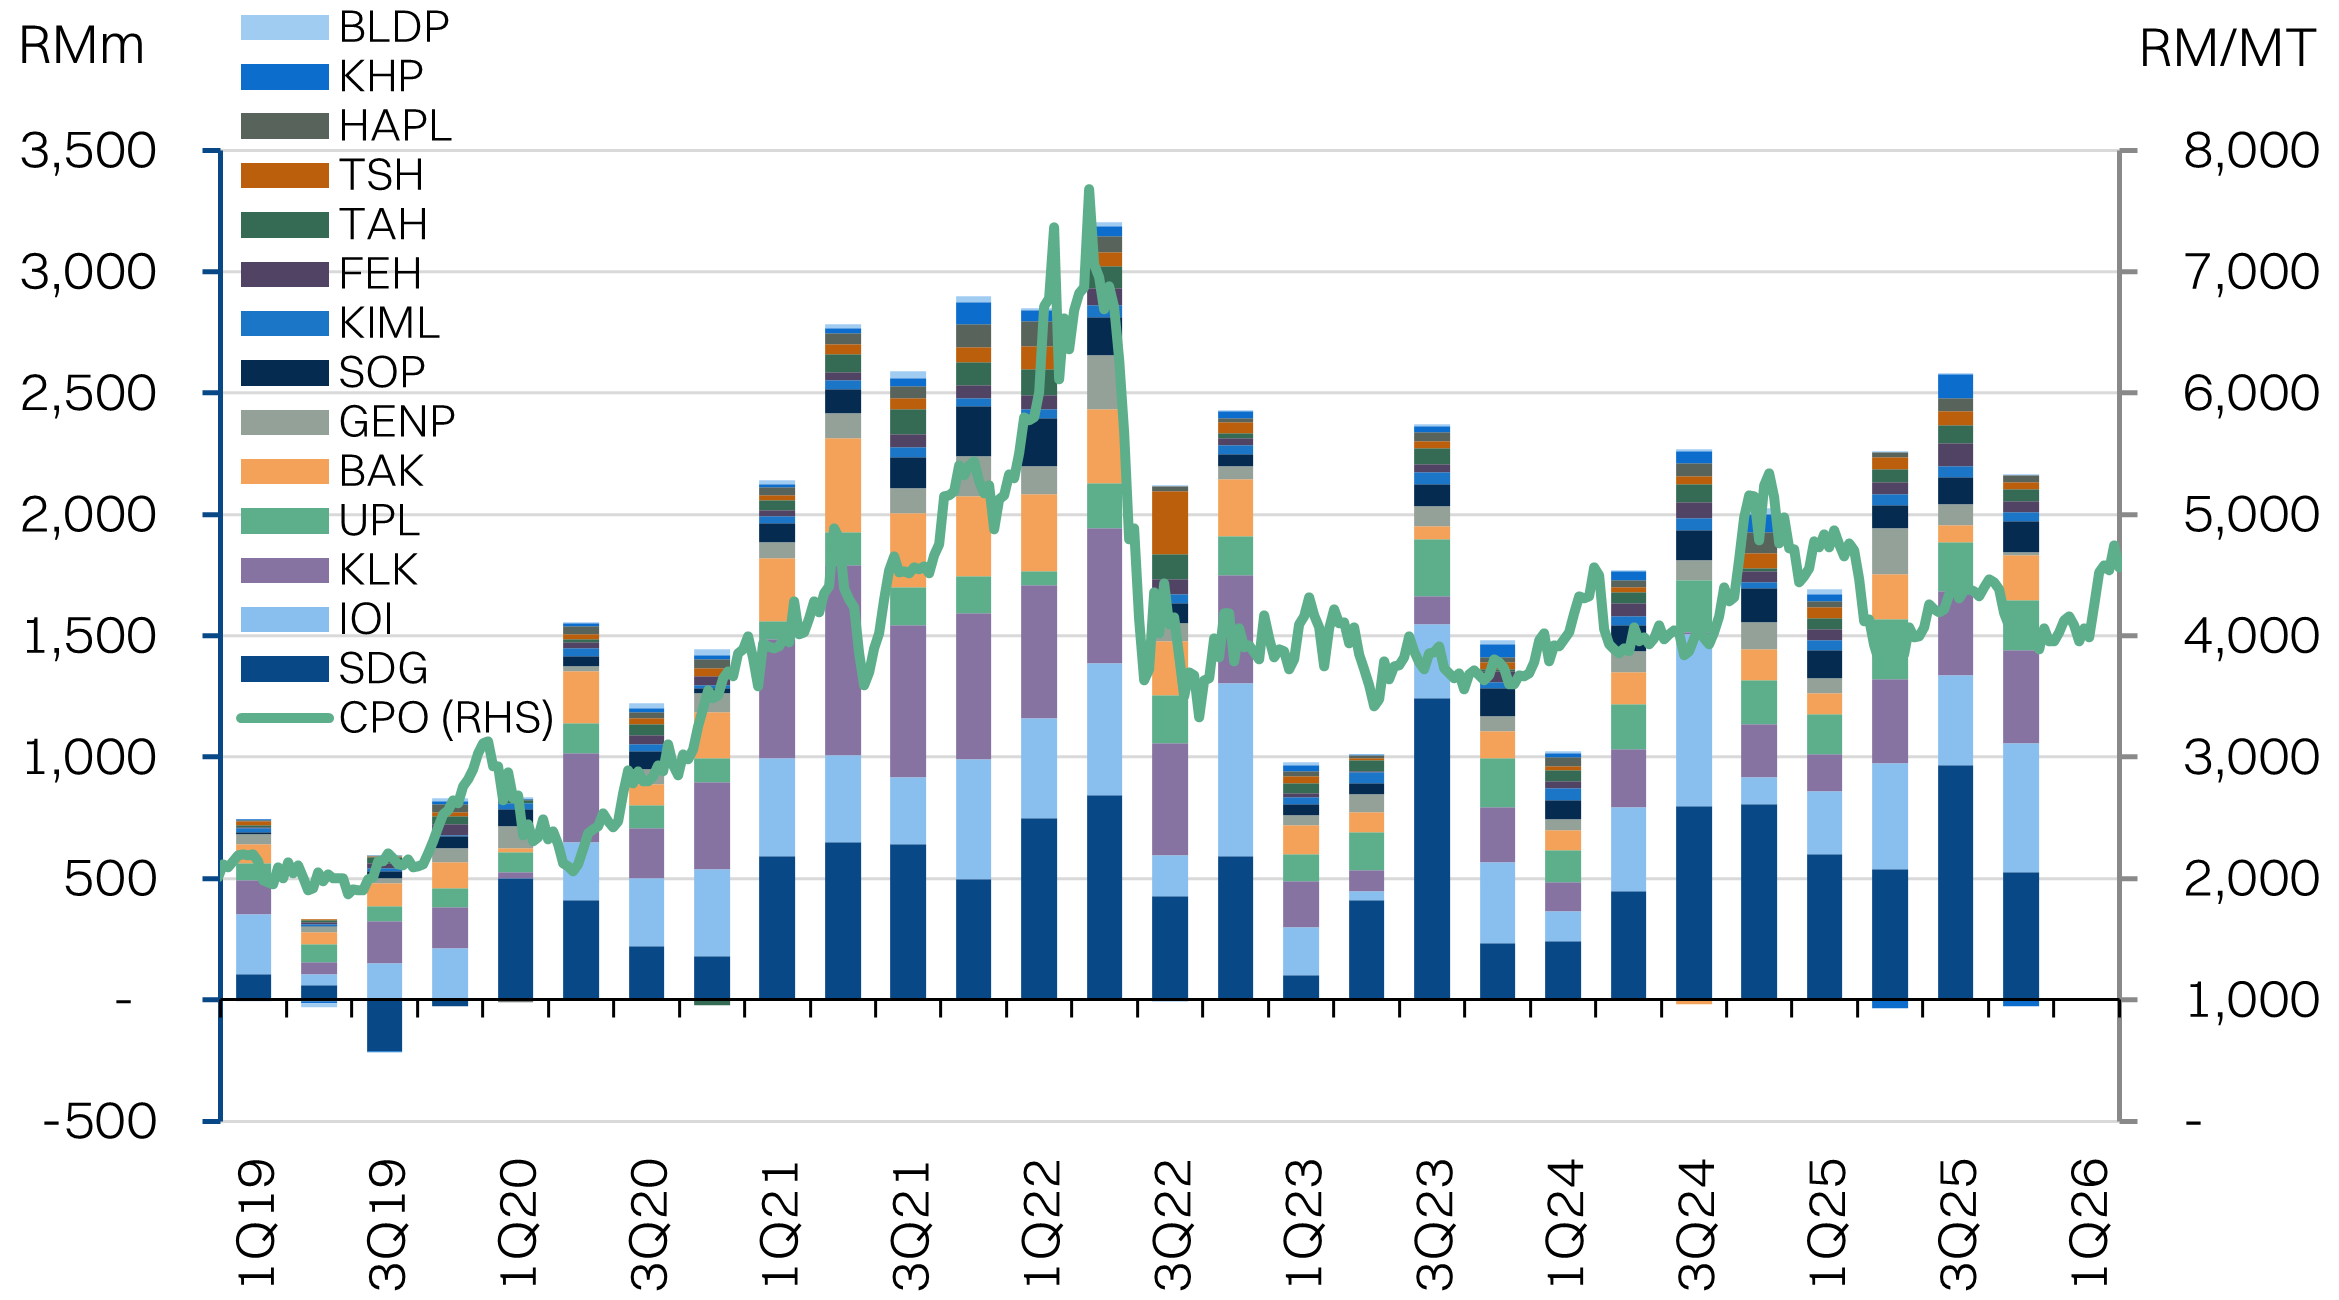
KL Plantations consensus earnings expectations vs CPO
CPO vs selected planters
Fertilizer prices put emphasis on efficient planters
So far, we’ve directed the focus at CPO prices. But another factor to consider is the higher fertiliser prices. The past five years has shown us that the sector can defend margins even if fertiliser prices are high, as long as supply-demand dynamics are tight enough to compensate with high CPO prices.
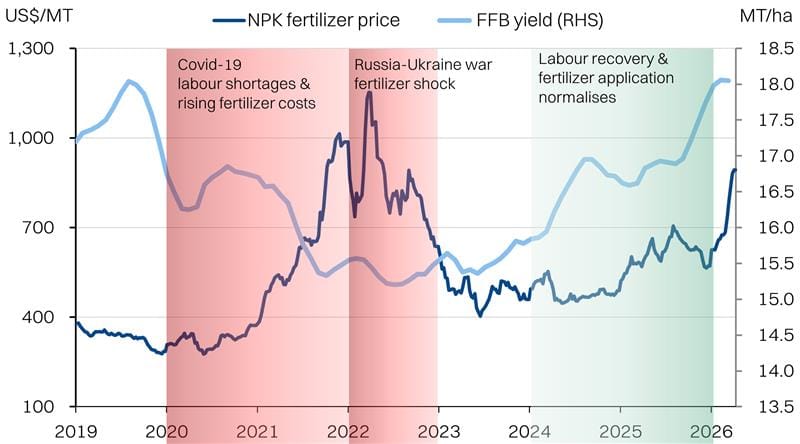
However, productivity can take a hit. A combination of labour shortages and high fertiliser prices saw fresh fruit bunch yields tumble from 2020-2022. Recovery began in 2023 with labour supply improving, but it took >12 months for the improved fertiliser application to lift yields back to pre-pandemic in late 2025.
The sudden jump in fertiliser prices this time around is likely to drive under-application again. Smallholders could be most prone to this issue, as the higher up-front fertiliser costs could pressure working capital. For big planters, under-application could manifest via pilferage. This does not preclude a worst-case scenario of physical supply shortages. We estimate the lower yields will take 9-12 months to manifest.
Broadly, we think this dynamic should skew investor preference towards high yield and high margin planters that demonstrate better overall cost-management and operational control. Nonetheless, we think under-application of fertilisers by smallholders (and subsequent drop in yields) will benefit the listed planters if overall productivity falls and drives up CPO prices.
Fertilizer prices vs CPO yields
Preference for efficient planters
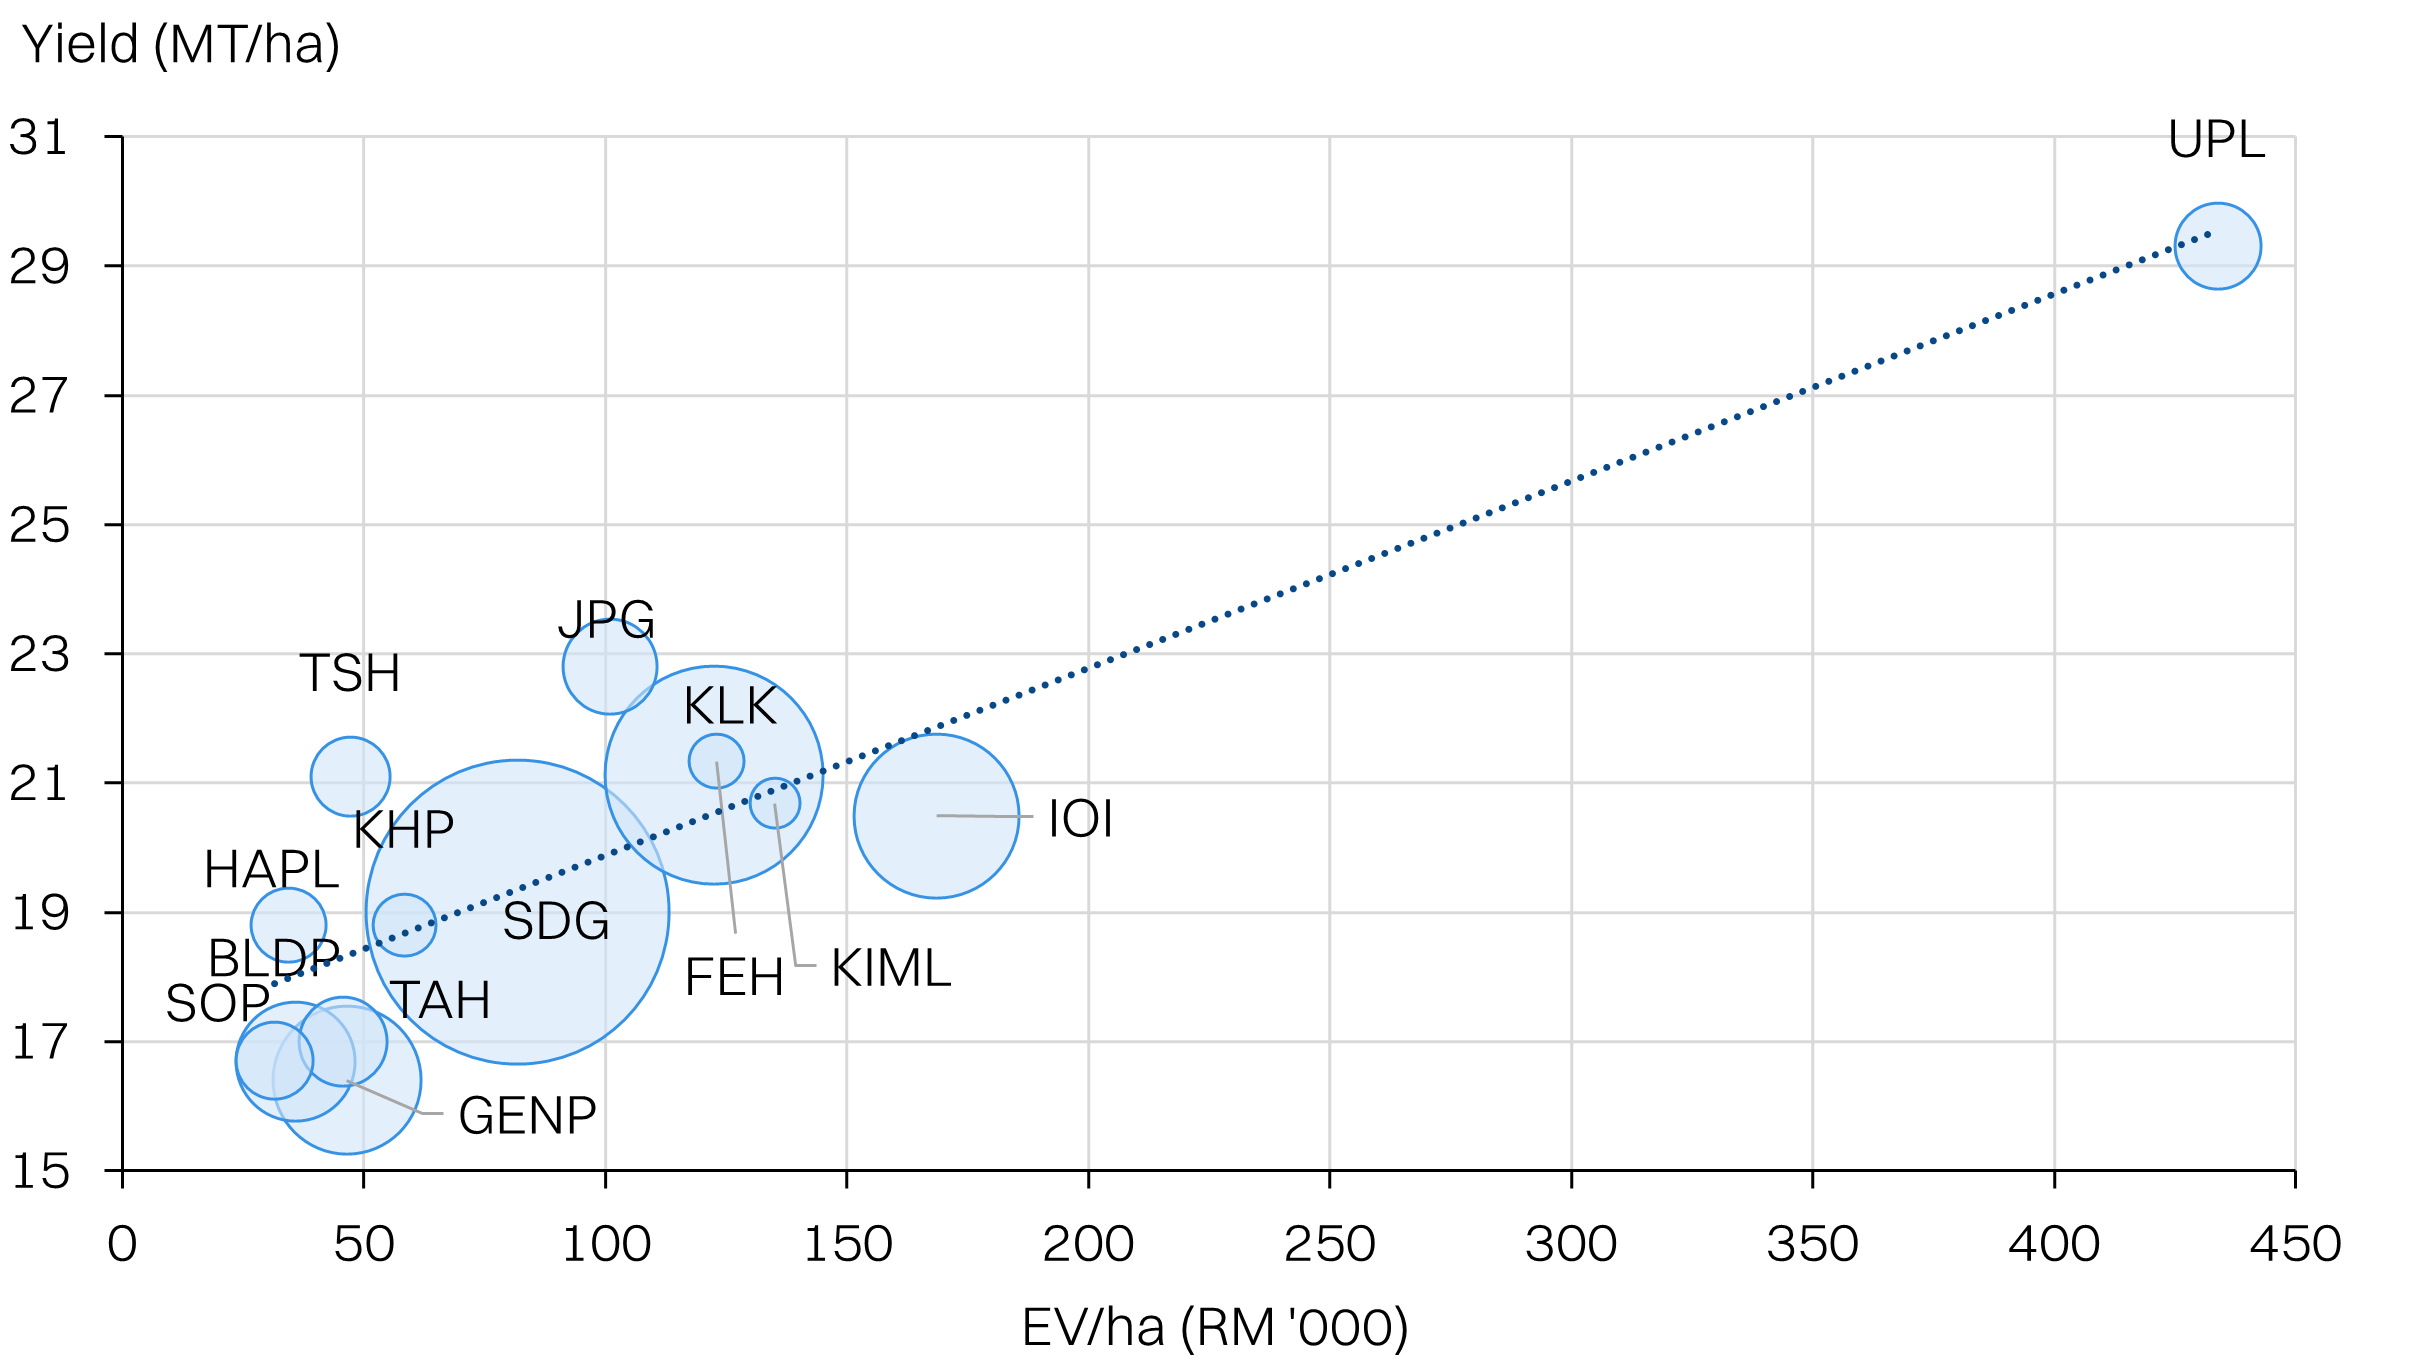
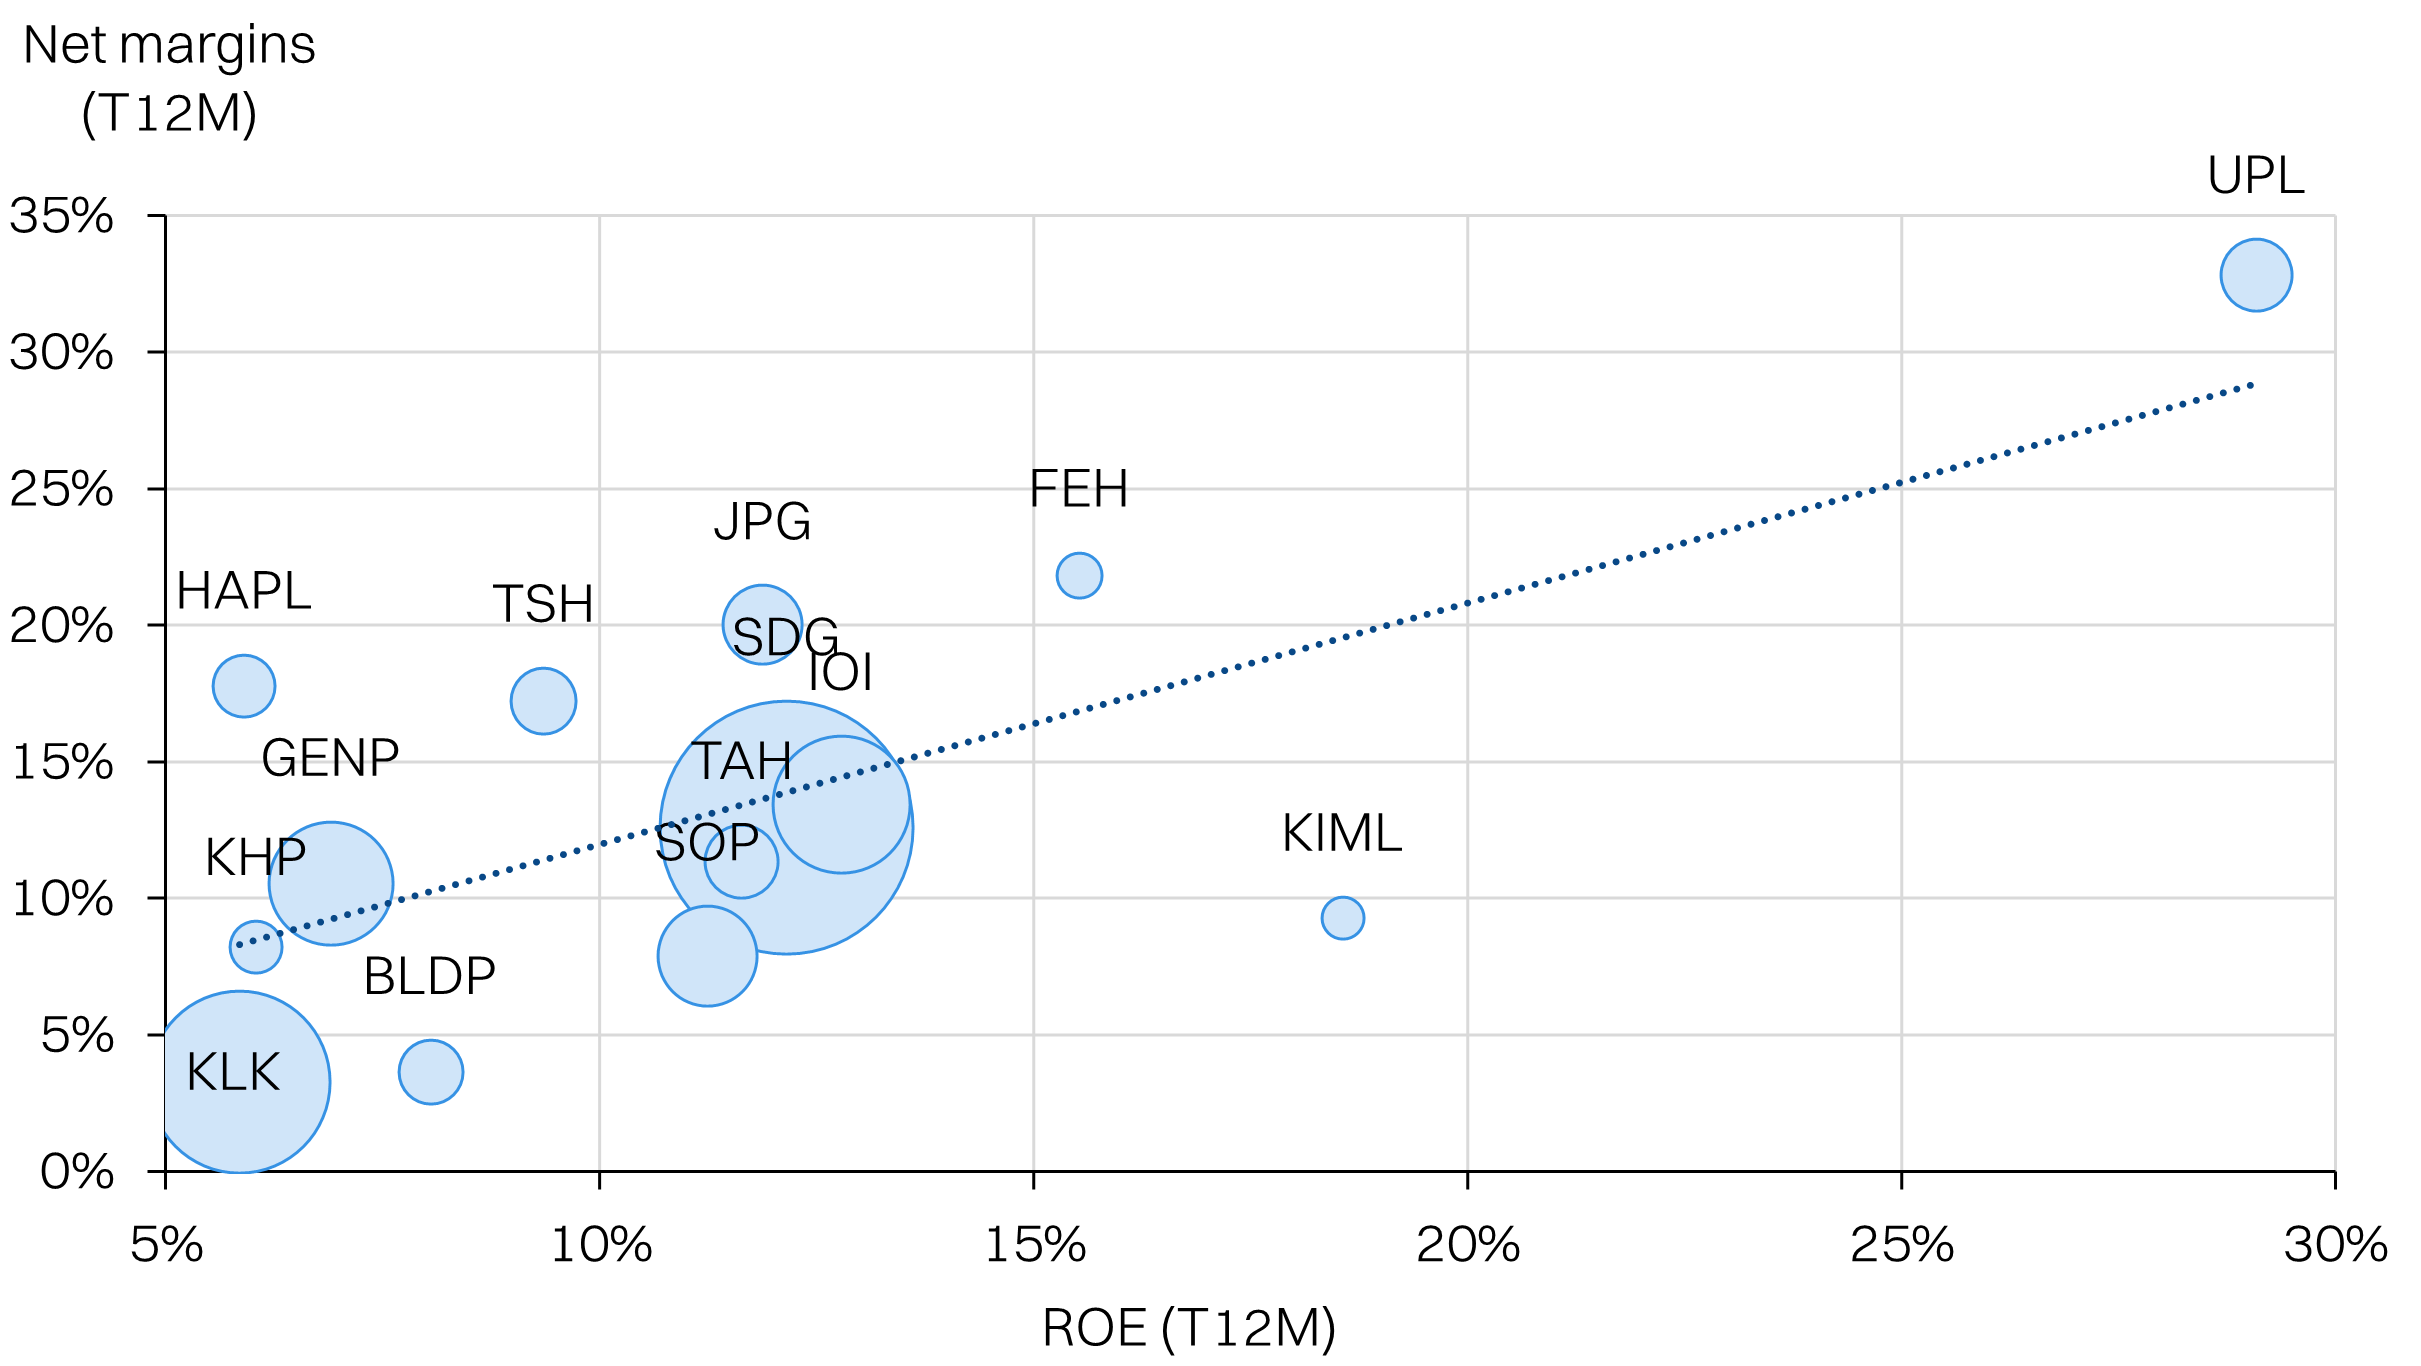
While high CPO prices will mask the cost shock, it is prudent to screen for planters that will be more resilient. In addition to fertiliser costs, which we have covered, higher diesel prices will also eat into margins. Higher yields also indicate planters that have qualitatively better operations and will have more control over fertiliser application going forward as well - minimizing wastage and pilferage.
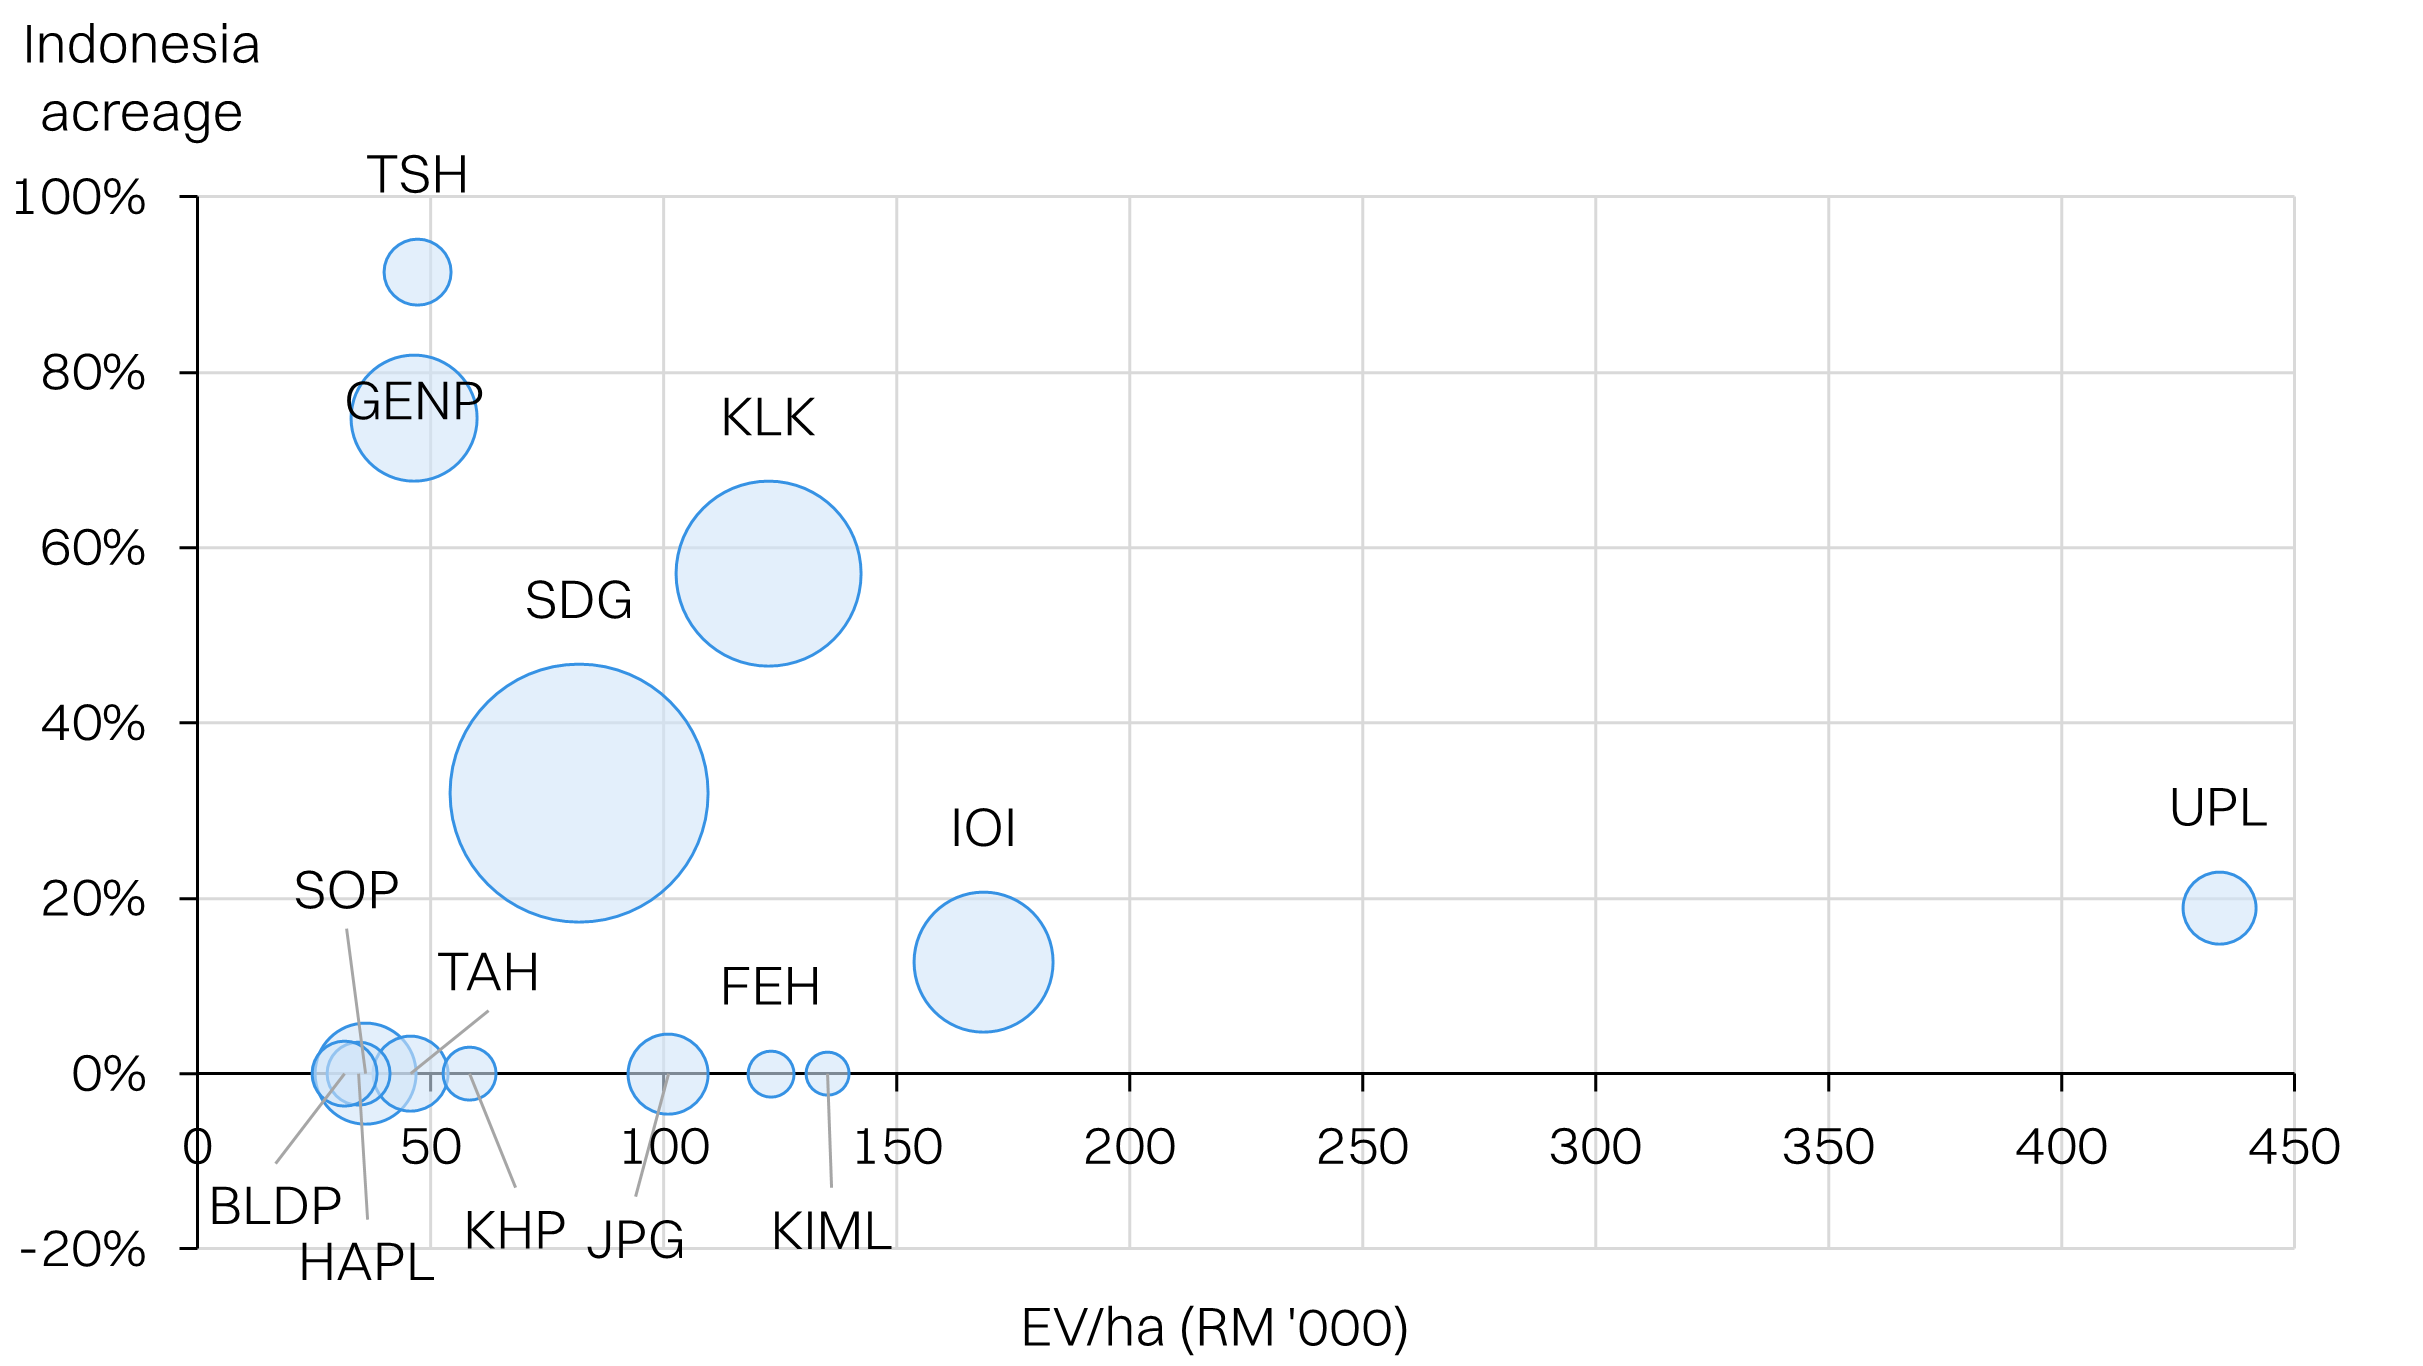
United Plantations (UPL) is the sector outlier for yields at >29MT/ha. However, this is well priced-in. Looking at relative valuations to yield, TSH Resources (TSH) and Johor Plantations Group (JPG) are the clear outliers. Followed by Kuala Lumpur Kepong (KLK) and Hap Seng Plantations.
On the other end of the spectrum, Genting Plantations (GENP) has the laggard yields, followed by Sarawak Oil Palms (SOP) and Ta Ann Holdings (TAH). IOI Corp is also below trend, relative to industry.
FFB yield vs EV/ha
Margins vs ROEs
Indonesia exposure poses risks
Indonesian government policy has been a recurring negative surprise for the industry since 2025, with the massive land seizures. Not only are planters without exposure shielded from the seizures, they can also benefit if Agrinas (Indonesia’s state-owned manager of the seized plantations) is not able to properly manage the massive 1.7m hectares it has suddenly ingested since 2025. Lower yields by Agrinas would tighten balances for CPO, but the exact impact of this is difficult to predict. Anecdotally, Agrinas has pulled in the pre-existing landowners to help run some of the seized estates.
Indonesian policy-making will be a wildcard for planters in 2026 as well, and this will extend beyond the land seizures. As a net importer, as well as a net importer of O&G, Indonesia’s policymakers lean heavily on domestic exports to help manage the trade deficit as well as domestic inflation.
The government has already raised the CPO export levy from 10 to 12.5%. This follows a hike from 7.5% to 10% last year. This is a source of tax revenue and helps fund the biodiesel blending mandates. We’ve covered the challenges to the biodiesel mandate, but all else equal it helps tighten global balances for CPO - incrementally positive for Malaysian planters.
Overall, we have a strong preference for planters with minimal or zero exposure to Indonesia. It reduces policy risks and also benefits from Indonesia’s move to tax/retain CPO onshore to manage the energy price crisis created by the war.
Relatively few planters within our screen have exposure. The key takeaway is the minimize exposure to names that do, like TSH, GENP and KLK, with >50% exposure.
Minimize Indonesia exposure
Picking and choosing
We are spoilt for choice within the plantations sector. For this report, we focused on the top 14 by market cap. Broadly, we like planters with lower valuations, high yields, high margins, and low exposure to Indonesia.
Planters we like: Overall, JPG screens well with reasonable valuations, as well as above sector yields and margins. It also has zero Indonesia exposure. TSH Resources also screens well, putting aside its Indonesian exposure. Relative to its above average yields, valuations are very reasonable at 11x PER. We think the Indonesian risks are well priced-in at this level. Among the big cap plantation stocks, our preference is IOI Corp for its lower Indonesia exposure vs peers. Valuations and yields are relatively close among the big 3, so avoiding risks would be key.
Minimize Indonesia exposure